CLIENT

VENUE PARTNER DATA SHEET
BUSINESS TO BUSINESS COLLATERAL
BUSINESS TO BUSINESS COLLATERAL
CONCEPT, LAYOUT, AND TYPOGRAPHY
PROJECT DATE | 2025
BRIEF
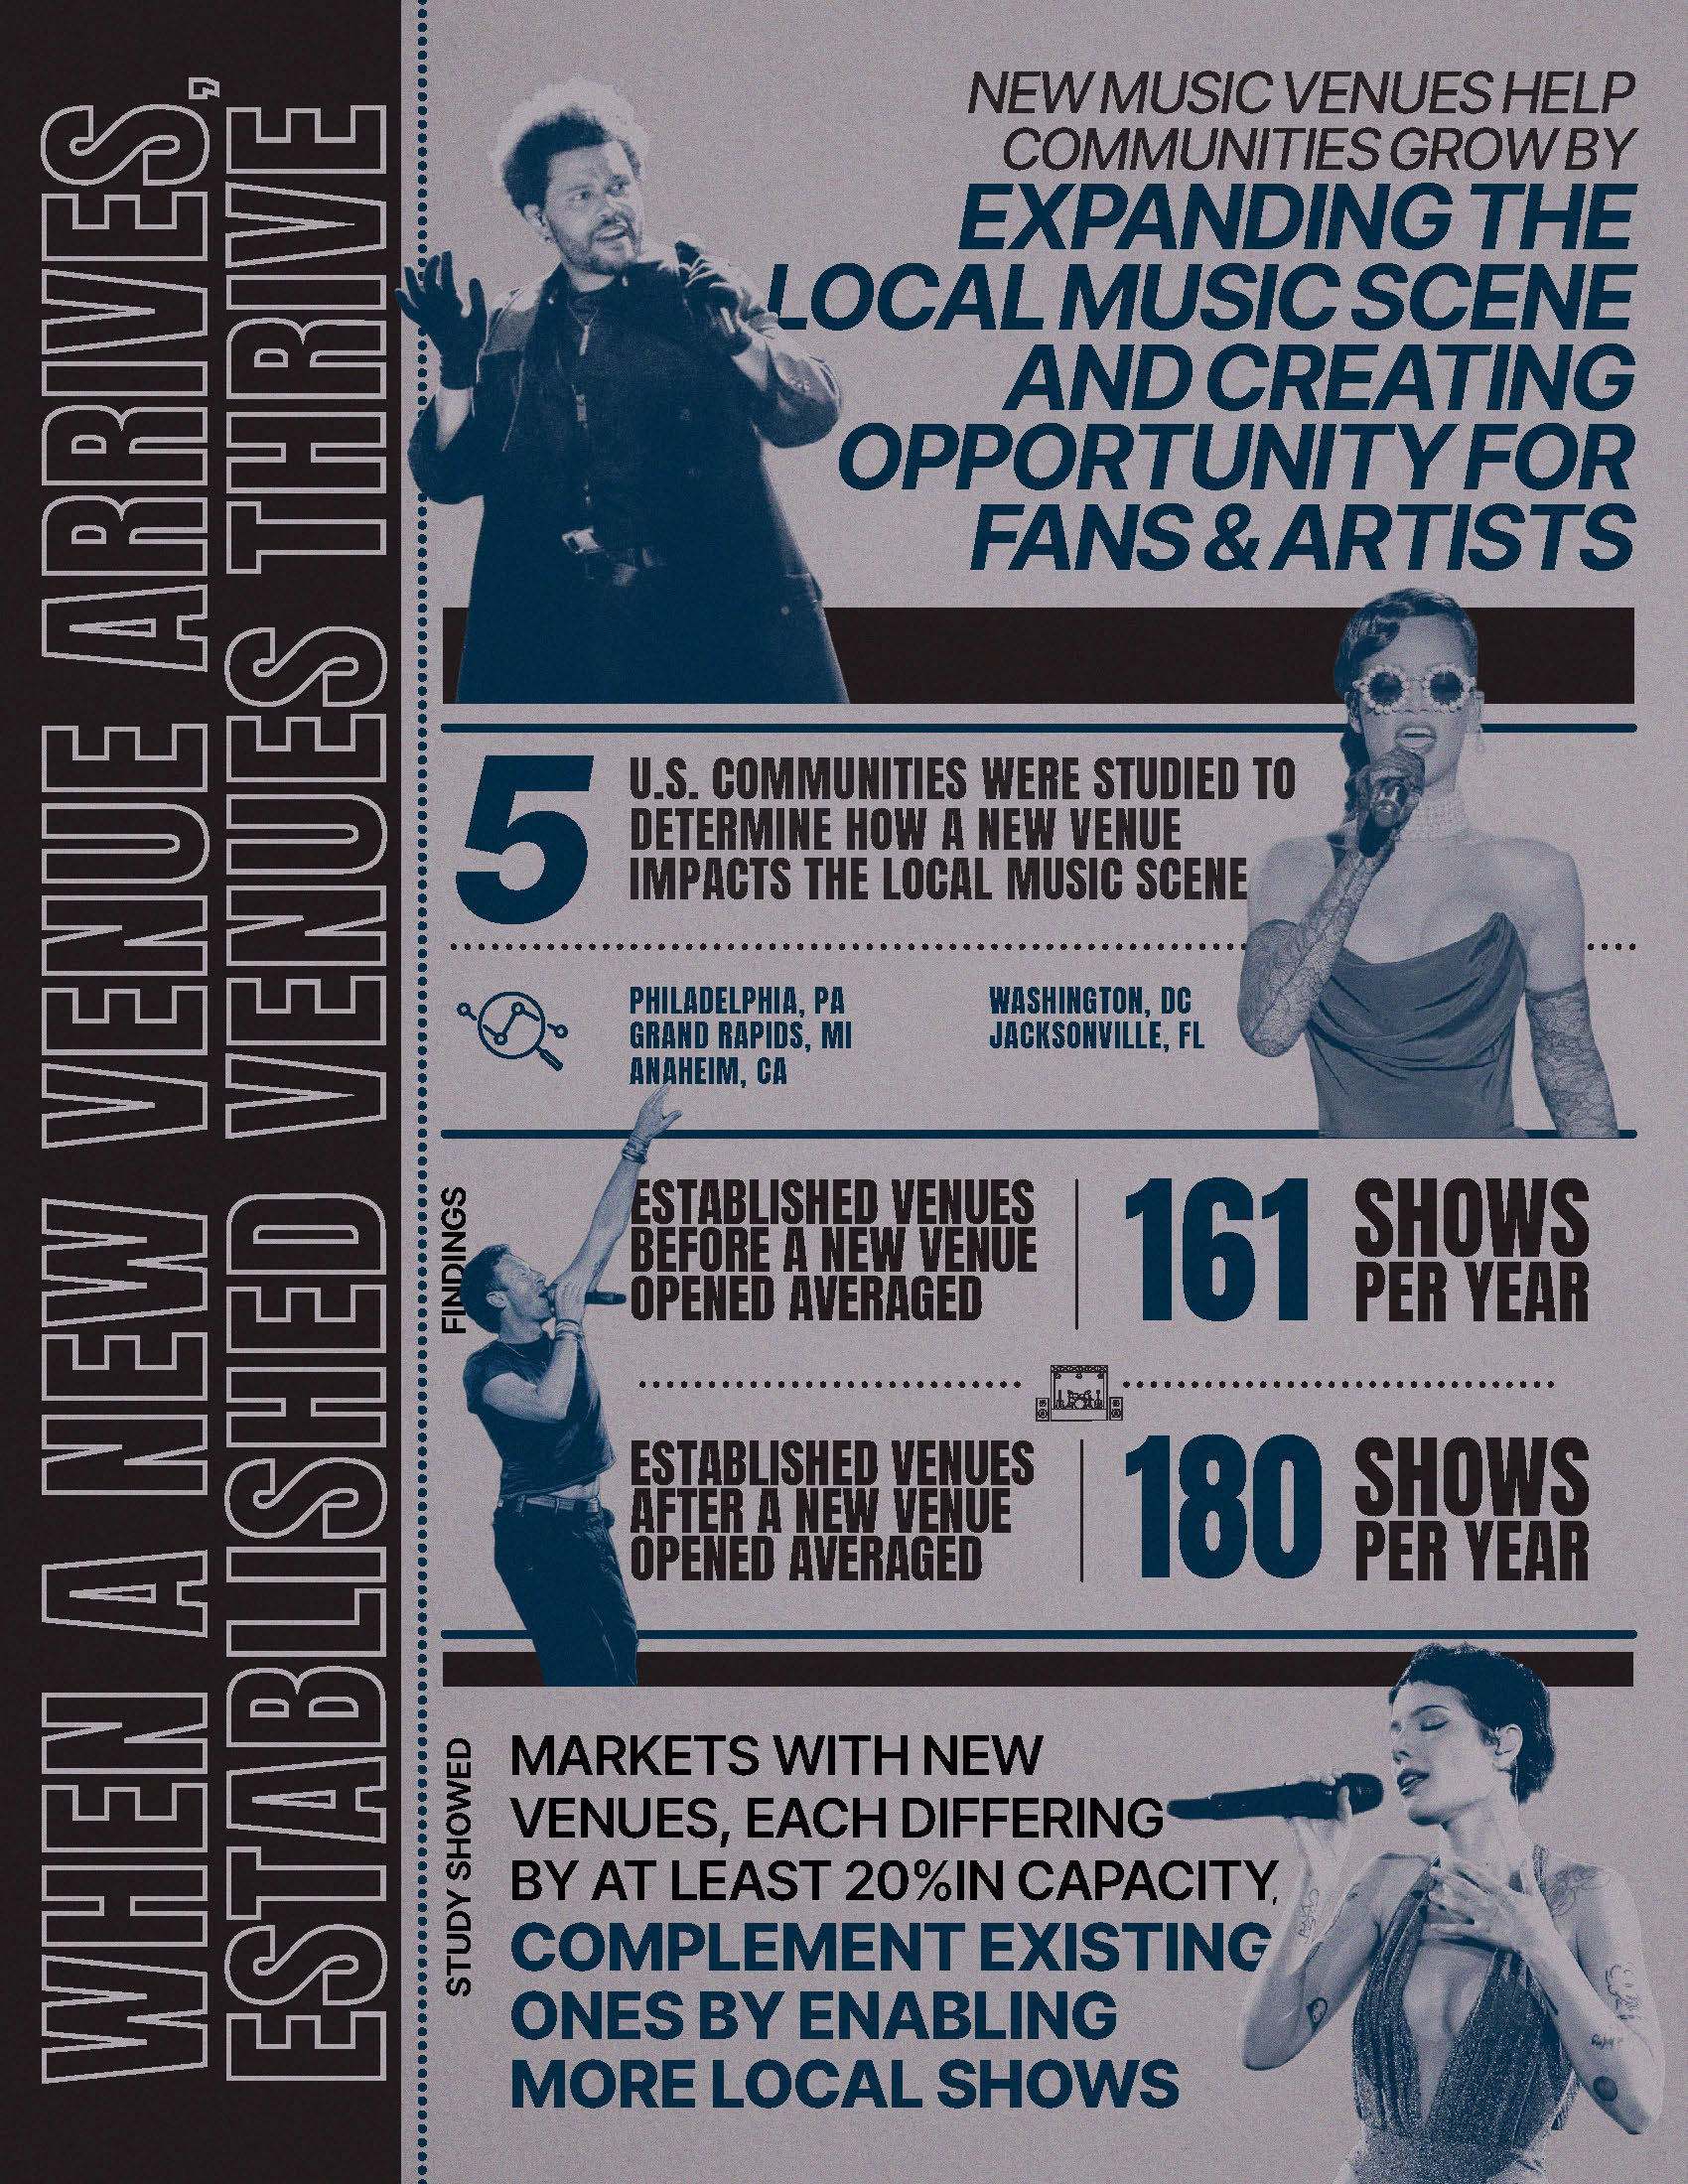
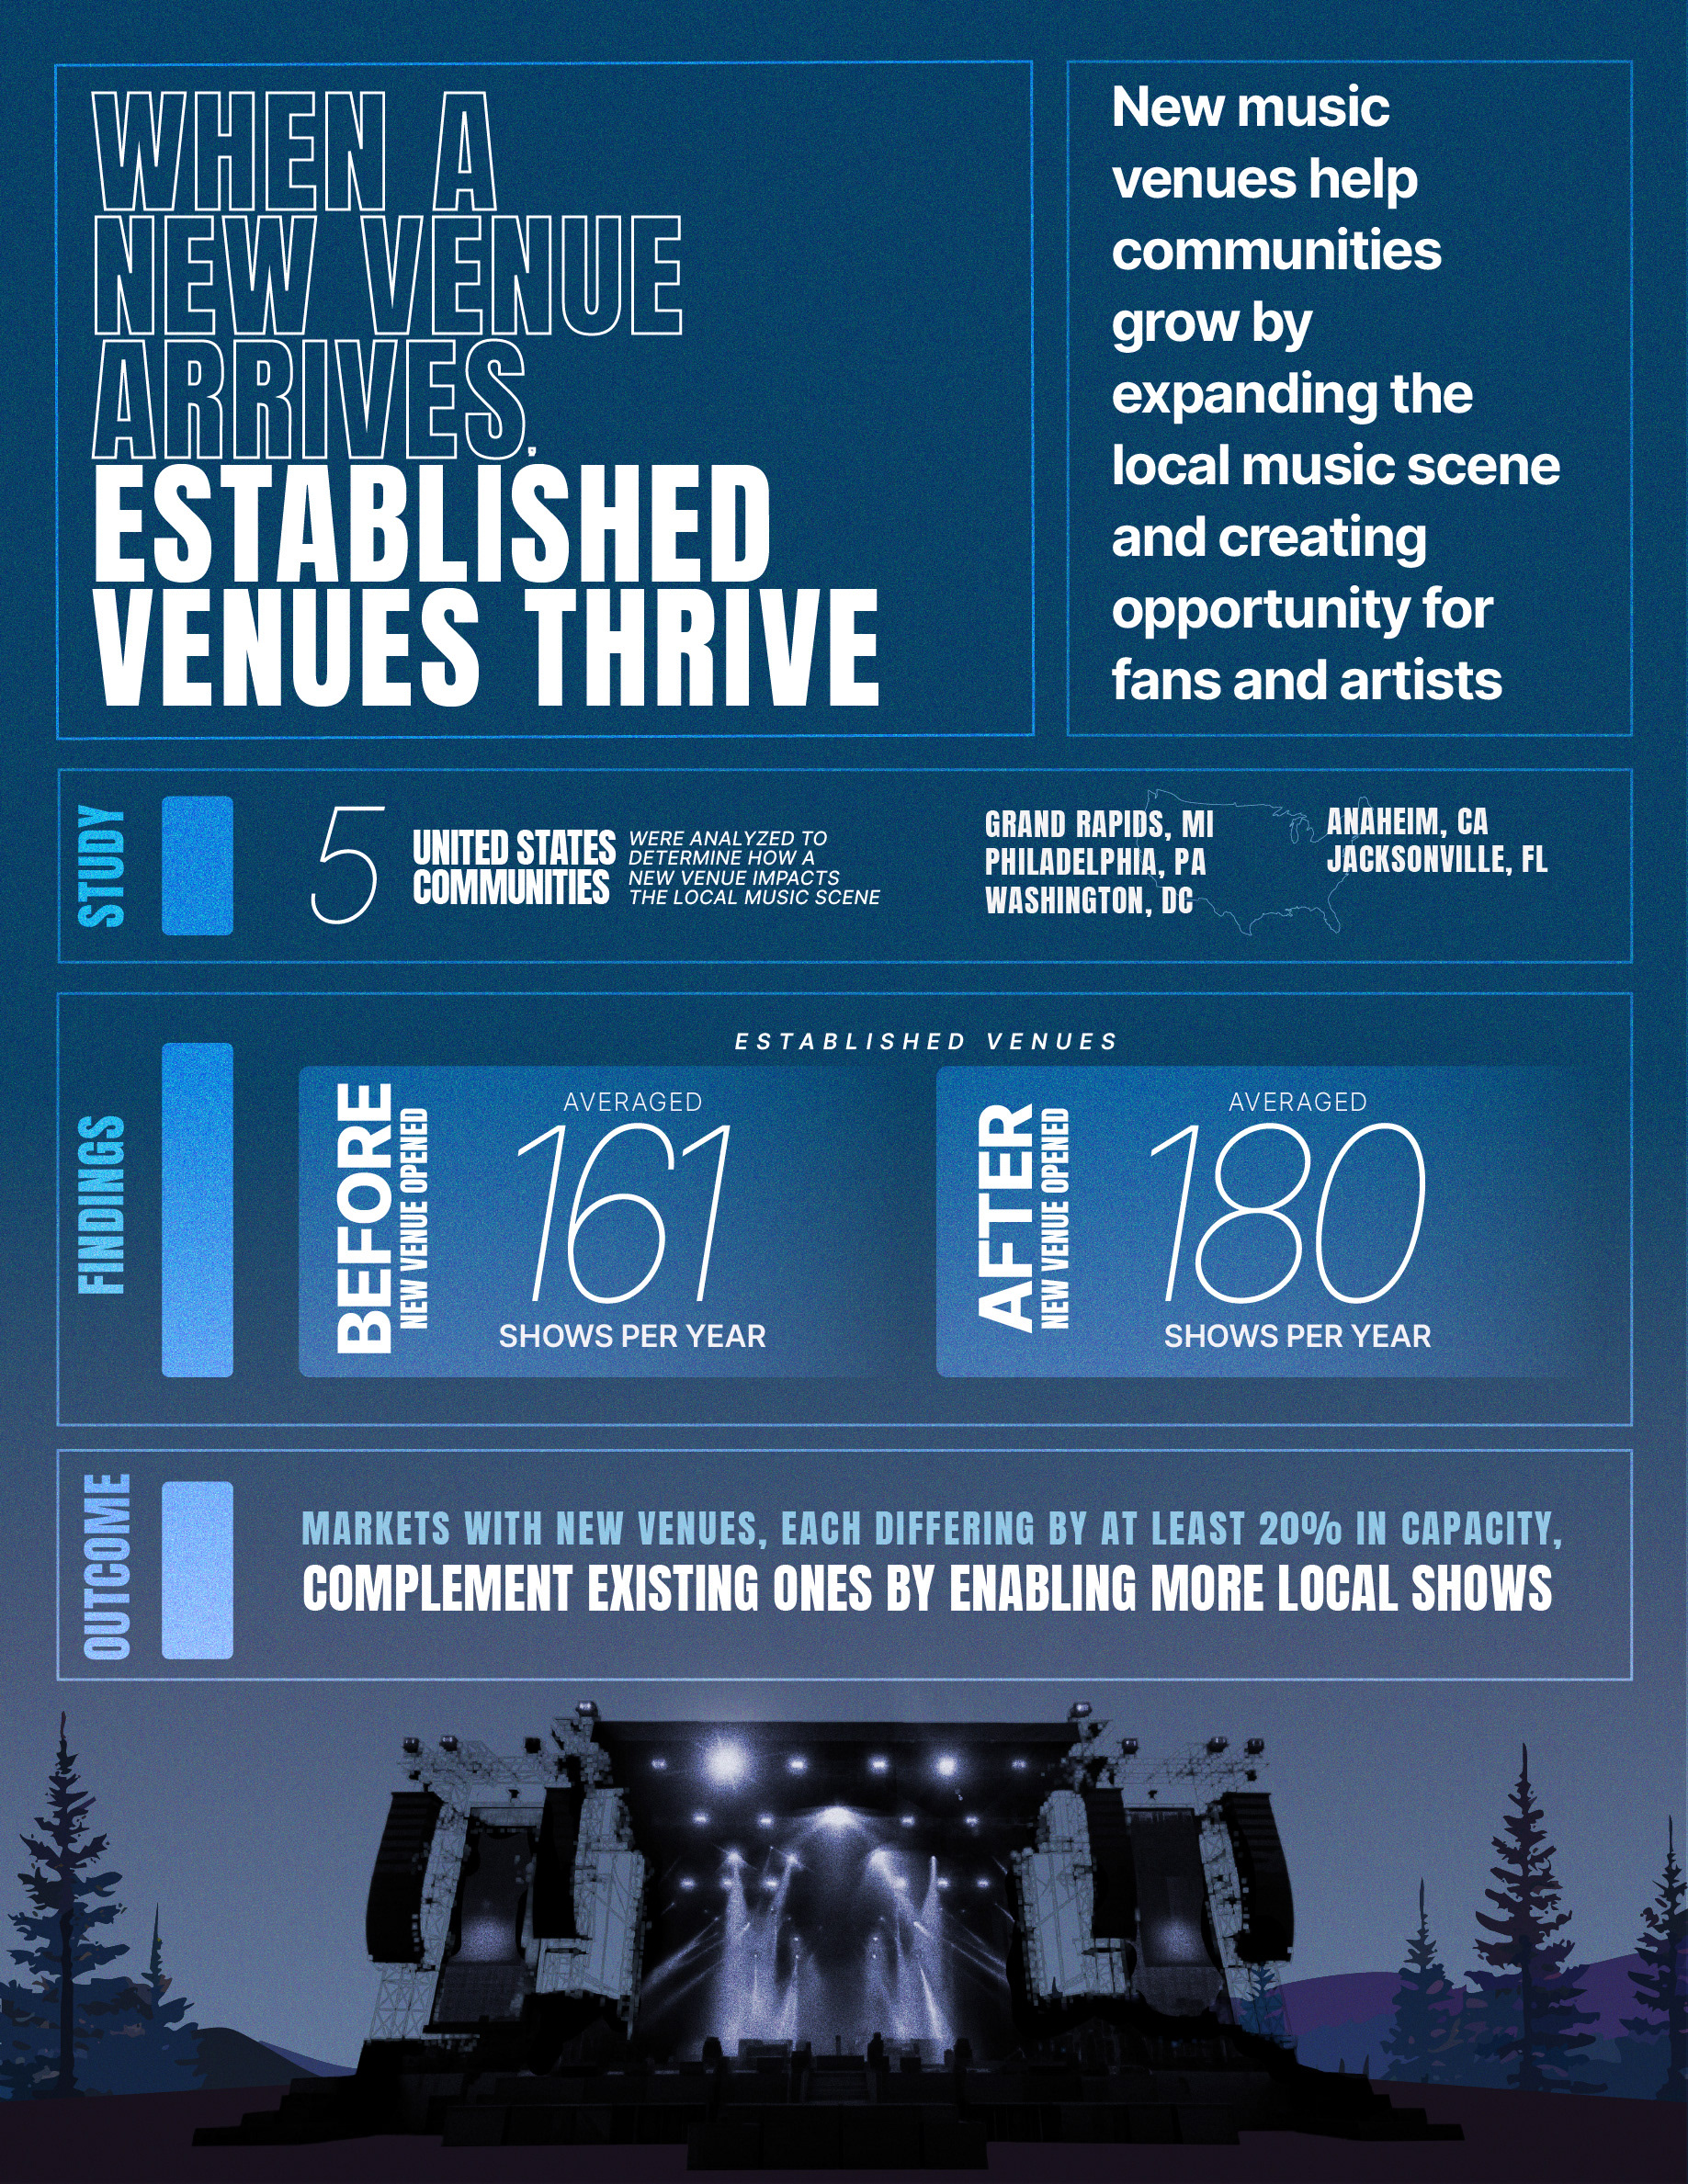
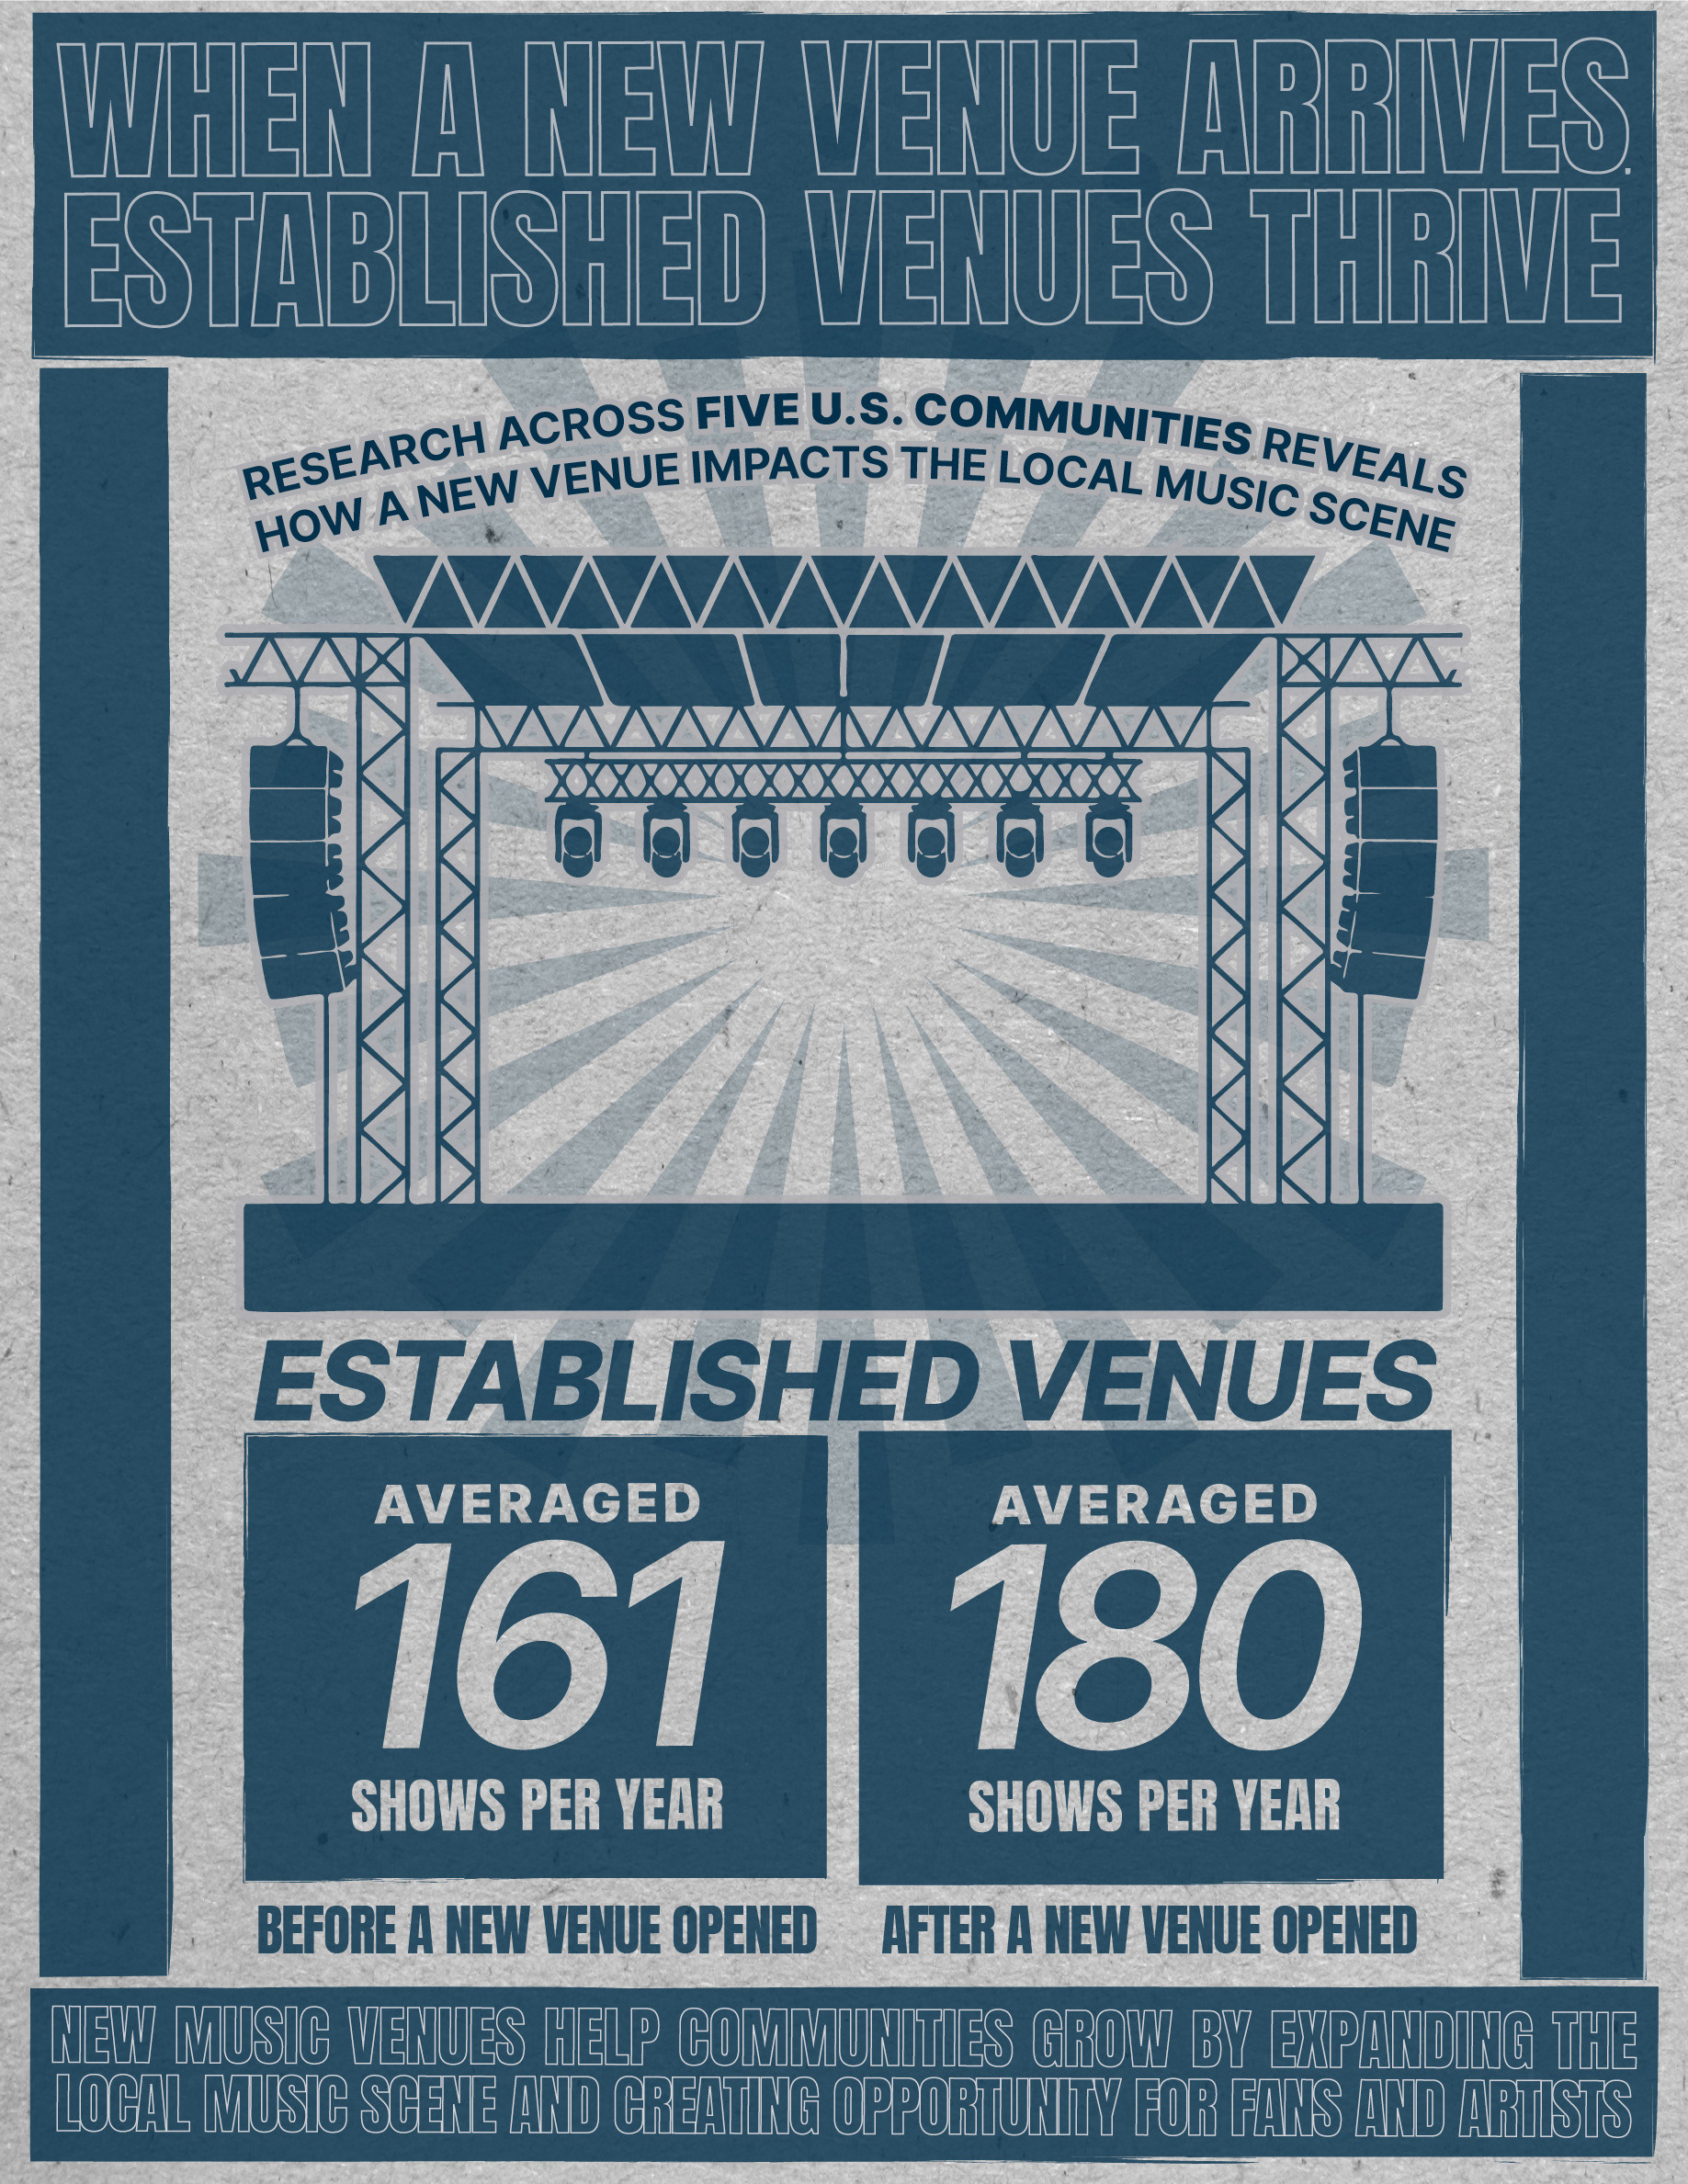
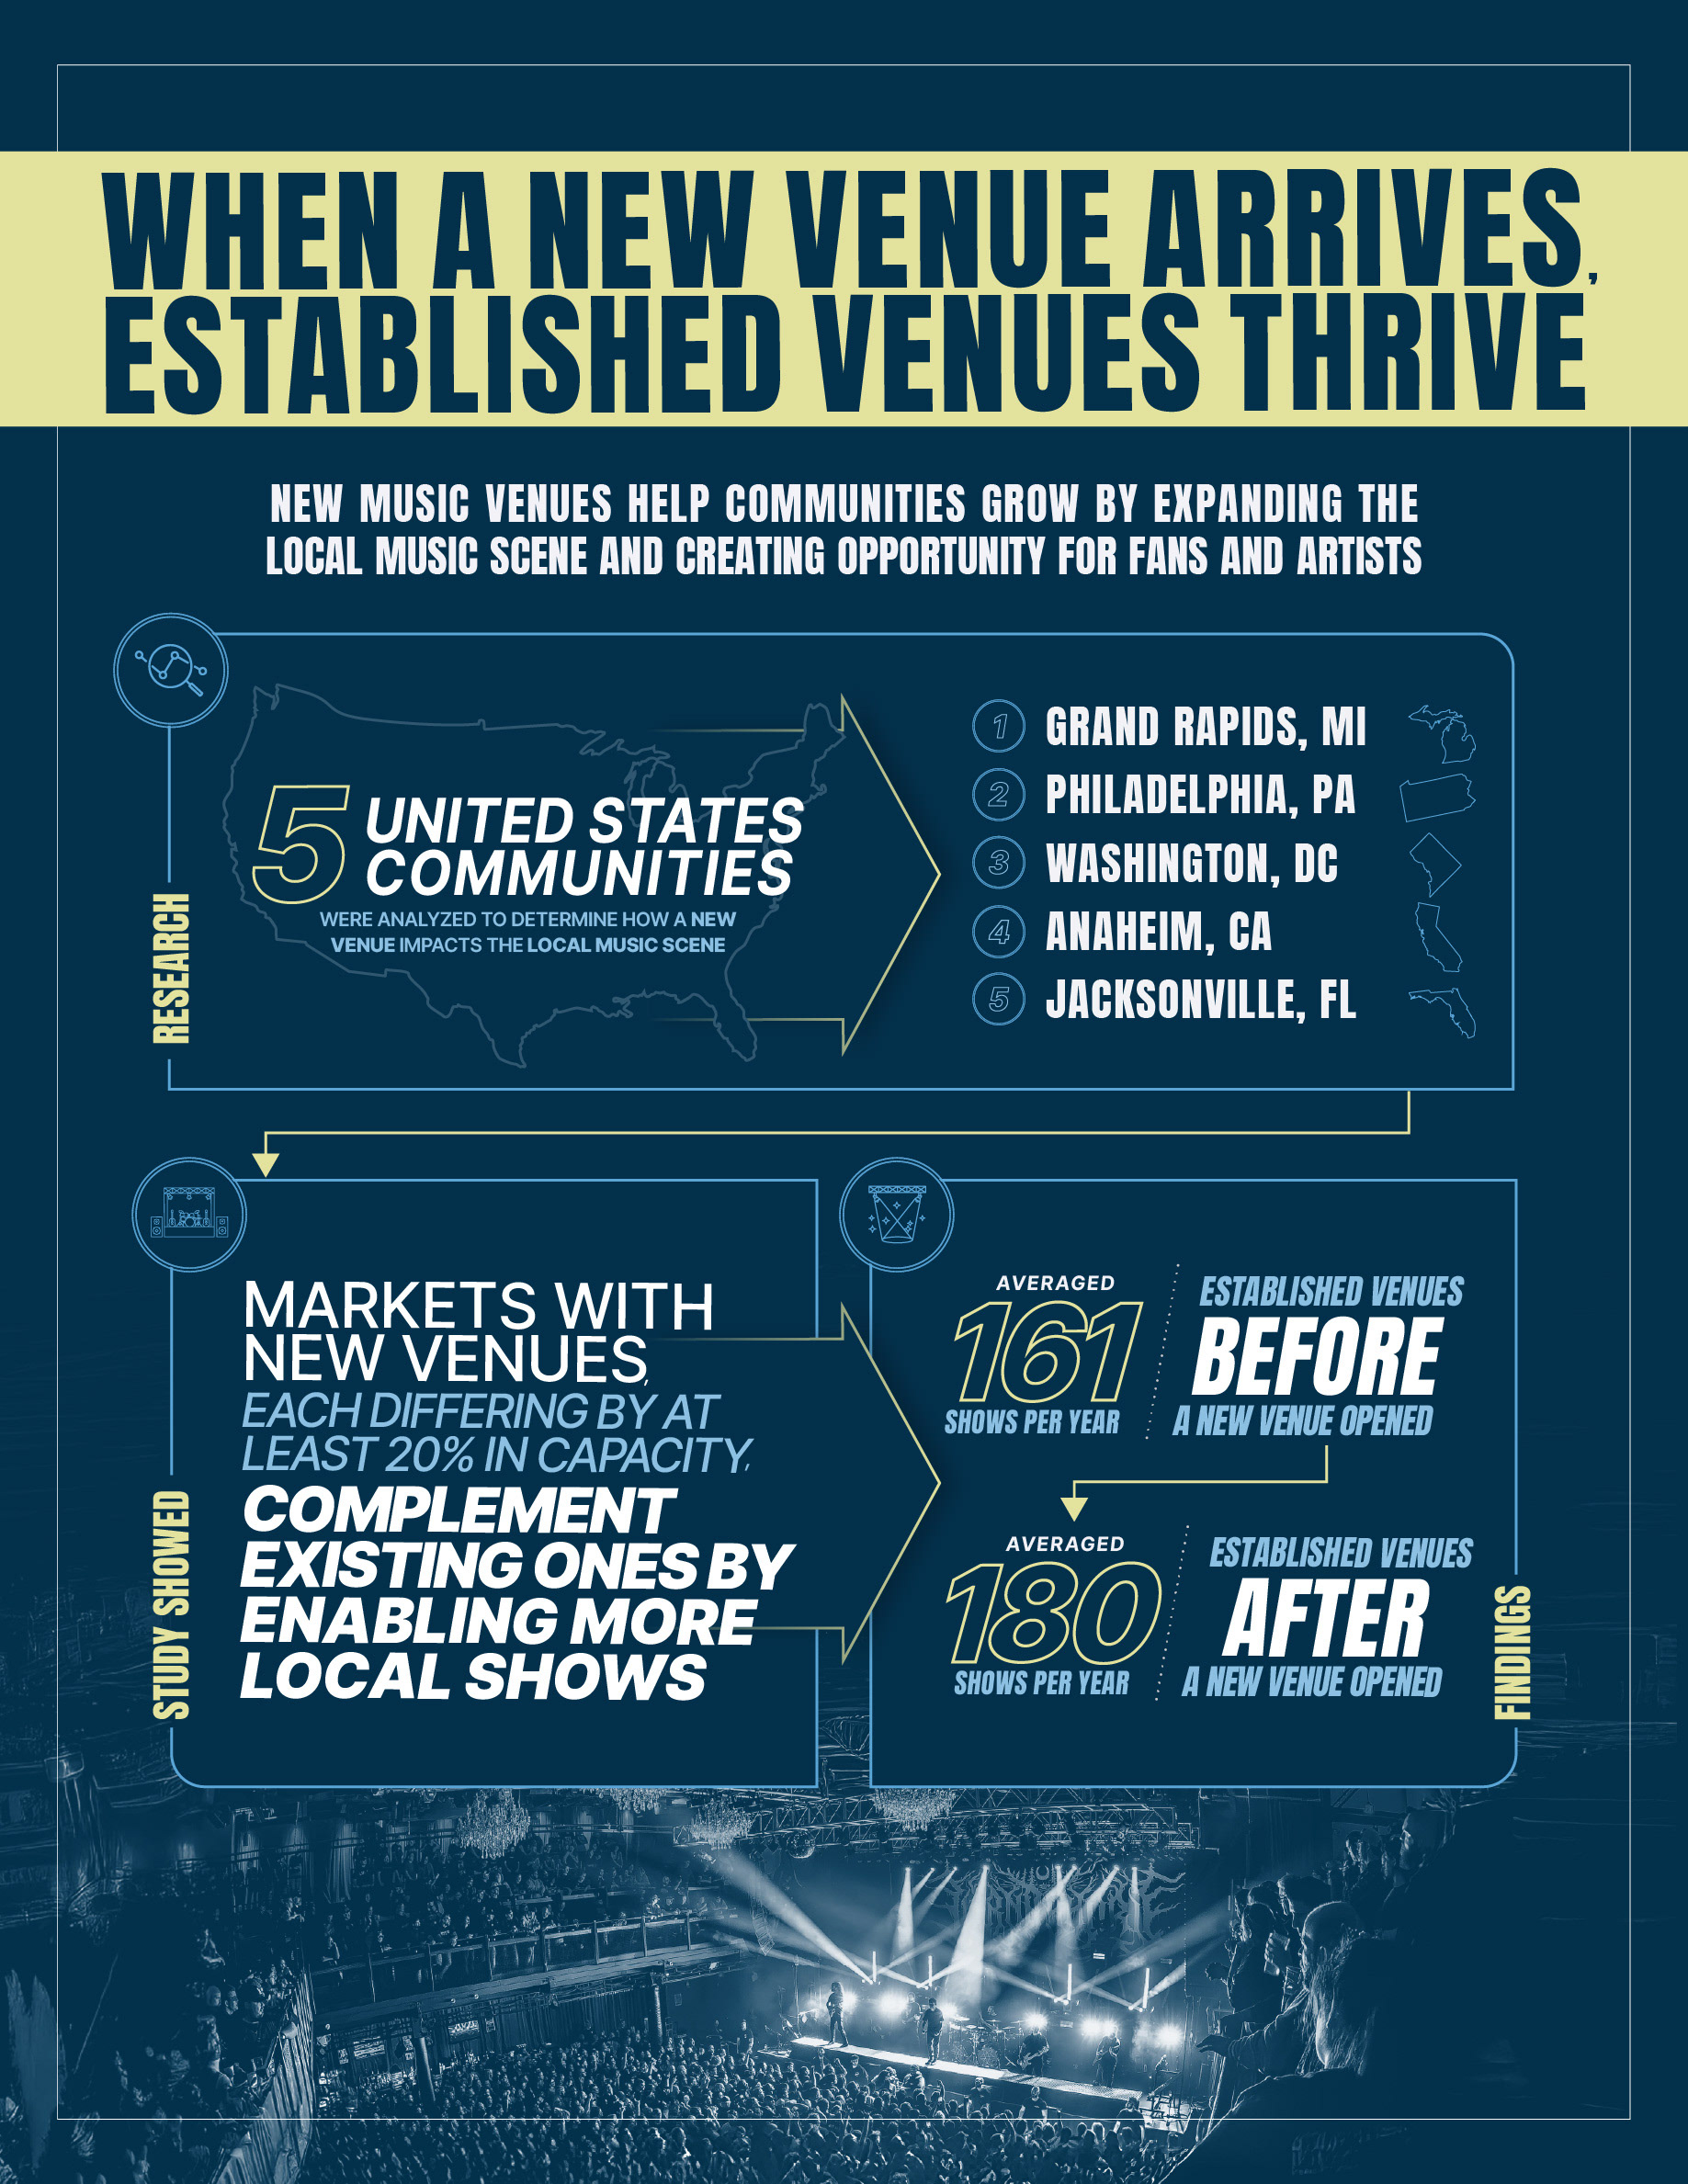
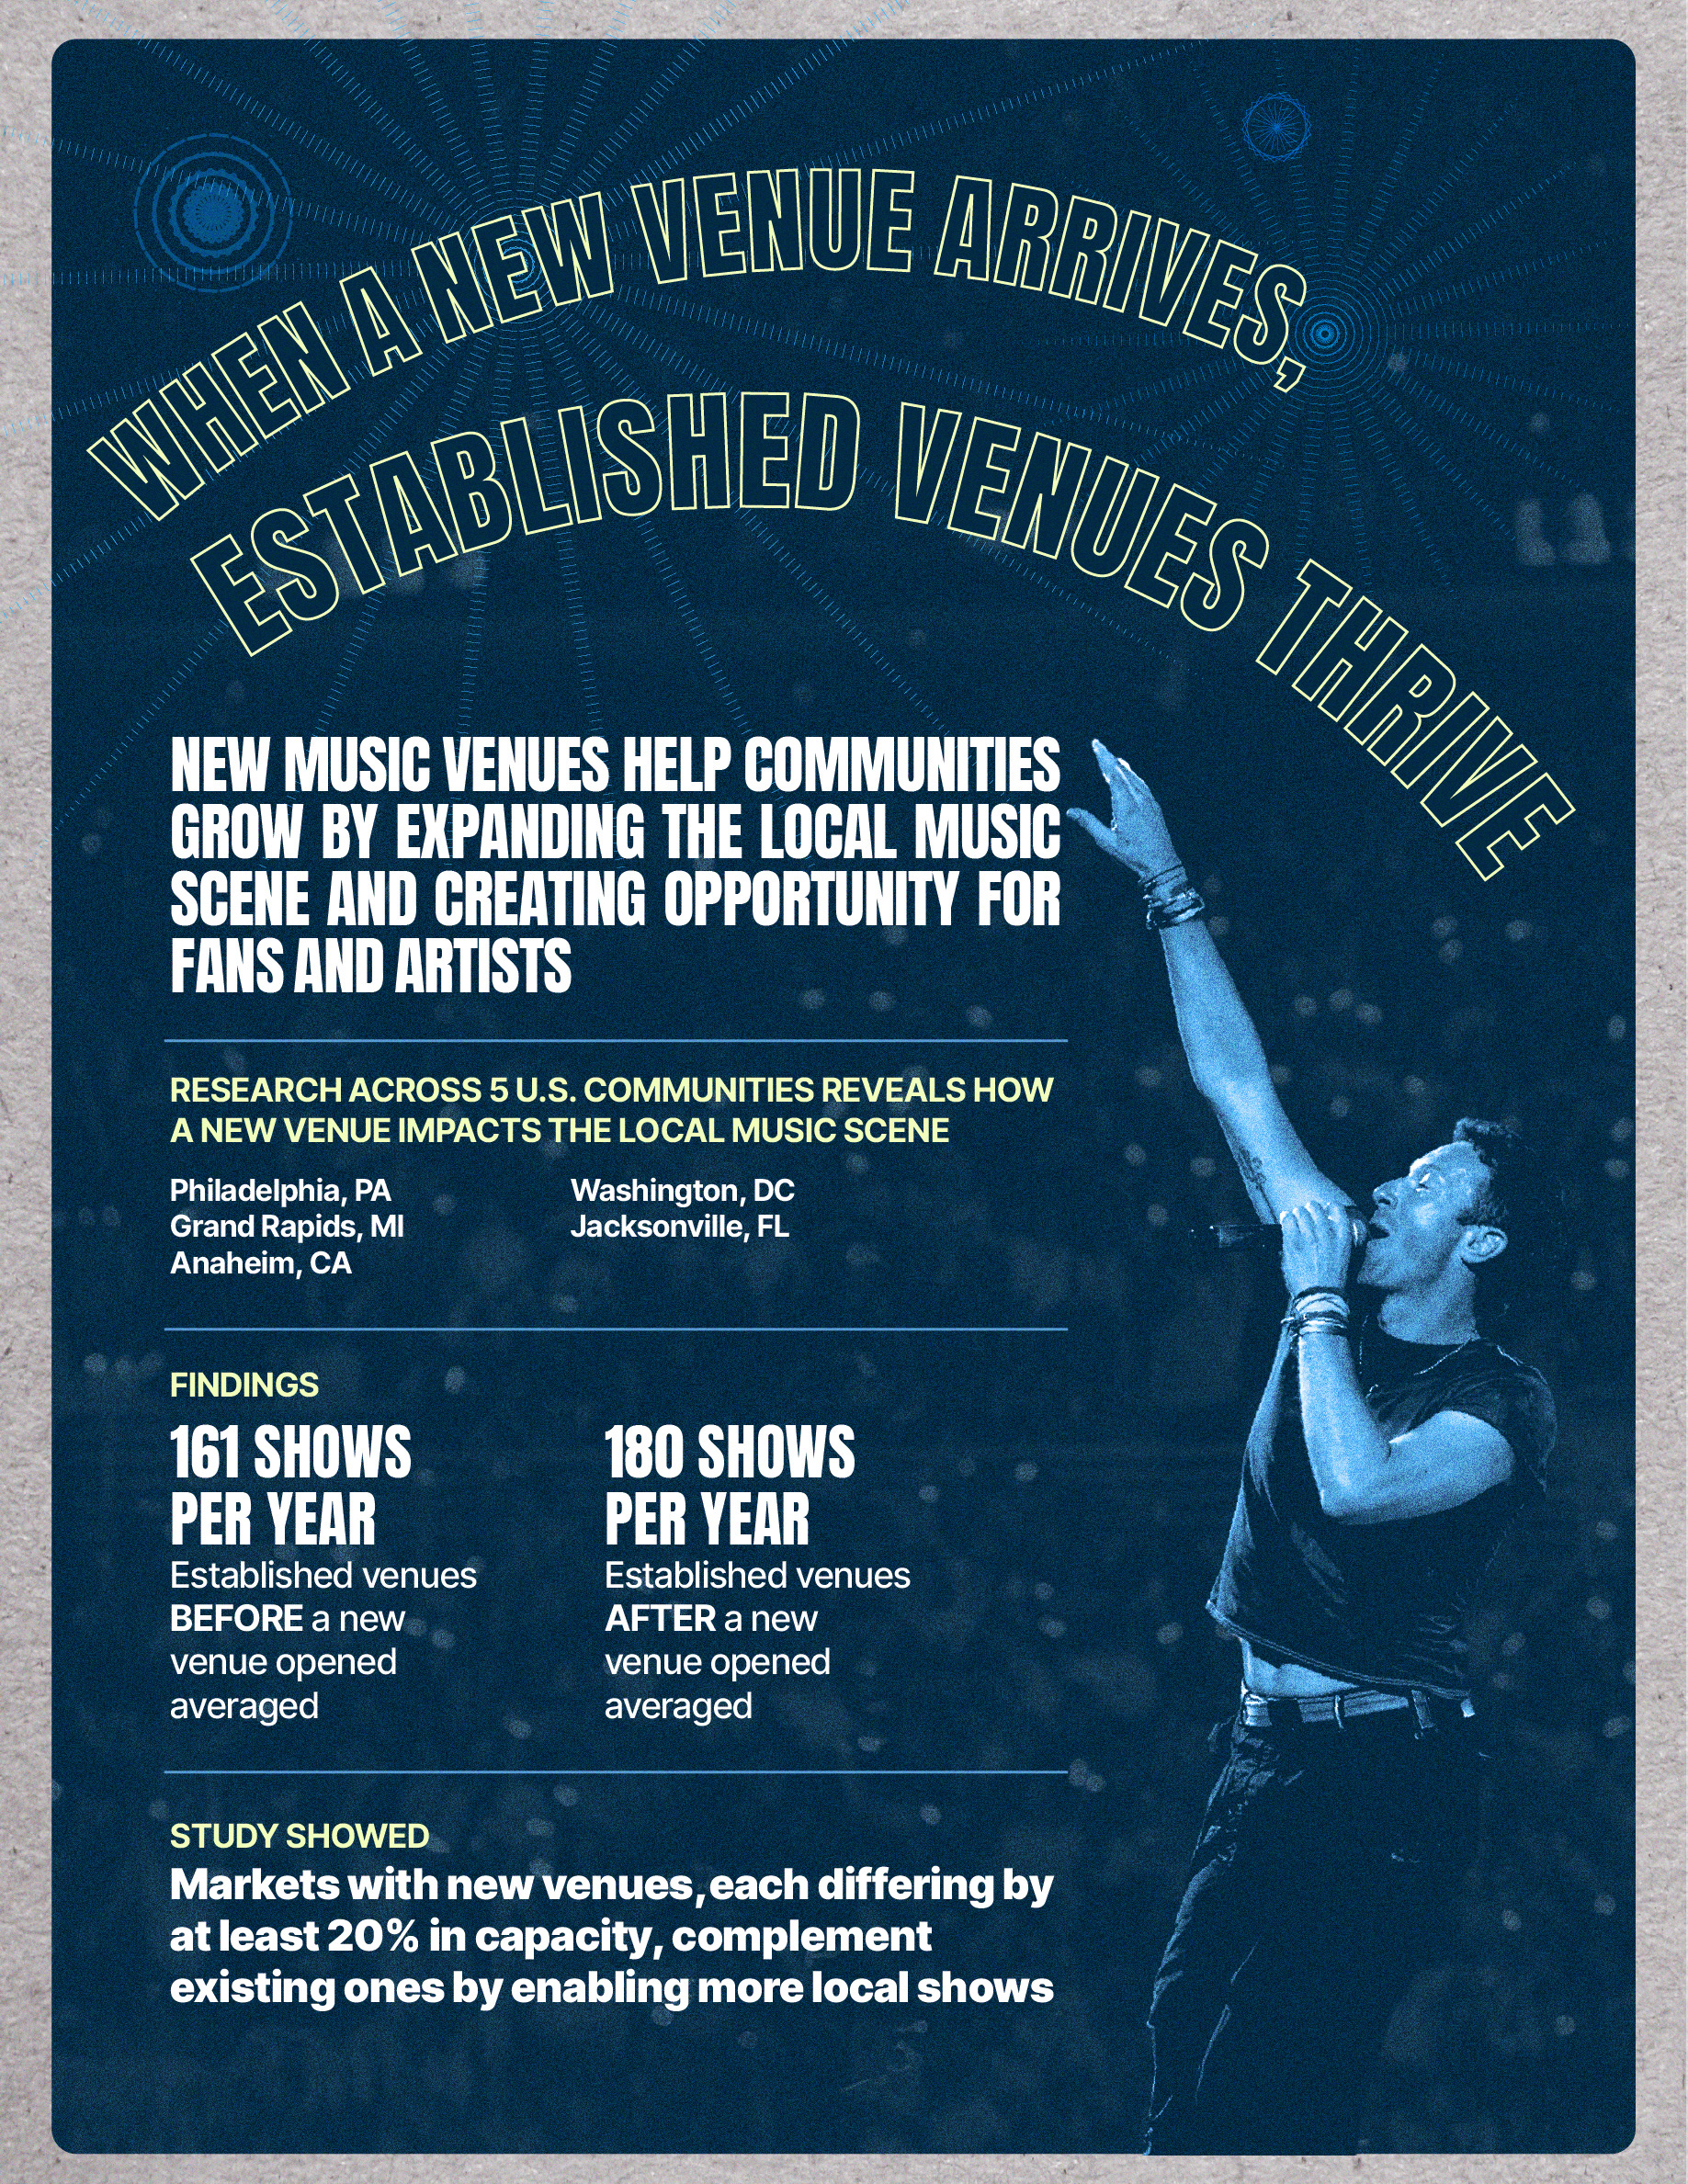
The live music industry battles a cynical myth: that big, new venues destroy scrappy local clubs. This “David vs. Goliath” narrative makes city planners nervous. Live Nation needed to shatter this misconception with hard data from five markets. The challenge was translating a dense impact study into a visual narrative proving the counter-intuitive truth: big stages actually create more opportunities for small ones.
STRATEGY
I developed a visual spectrum ranging from visceral to analytical. One direction captures the grit and soul of the front row through texture and type, while the other utilizes clean grids for corporate authority. This flexible system ensures the data resonates with every stakeholder, from fans to city officials, proving a new venue is an amplifier, not a threat.
CLIENT
FOR


FEATURE FILM PITCH
PRESENTATION DECK
PRESENTATION DECK
LAYOUT, TYPOGRAPHY, DATA VISUALIZATION, IMAGE SELECTION, PHOTO MANIPULATION, AND COMPOSITING
PROJECT DATE | 2025
BRIEF
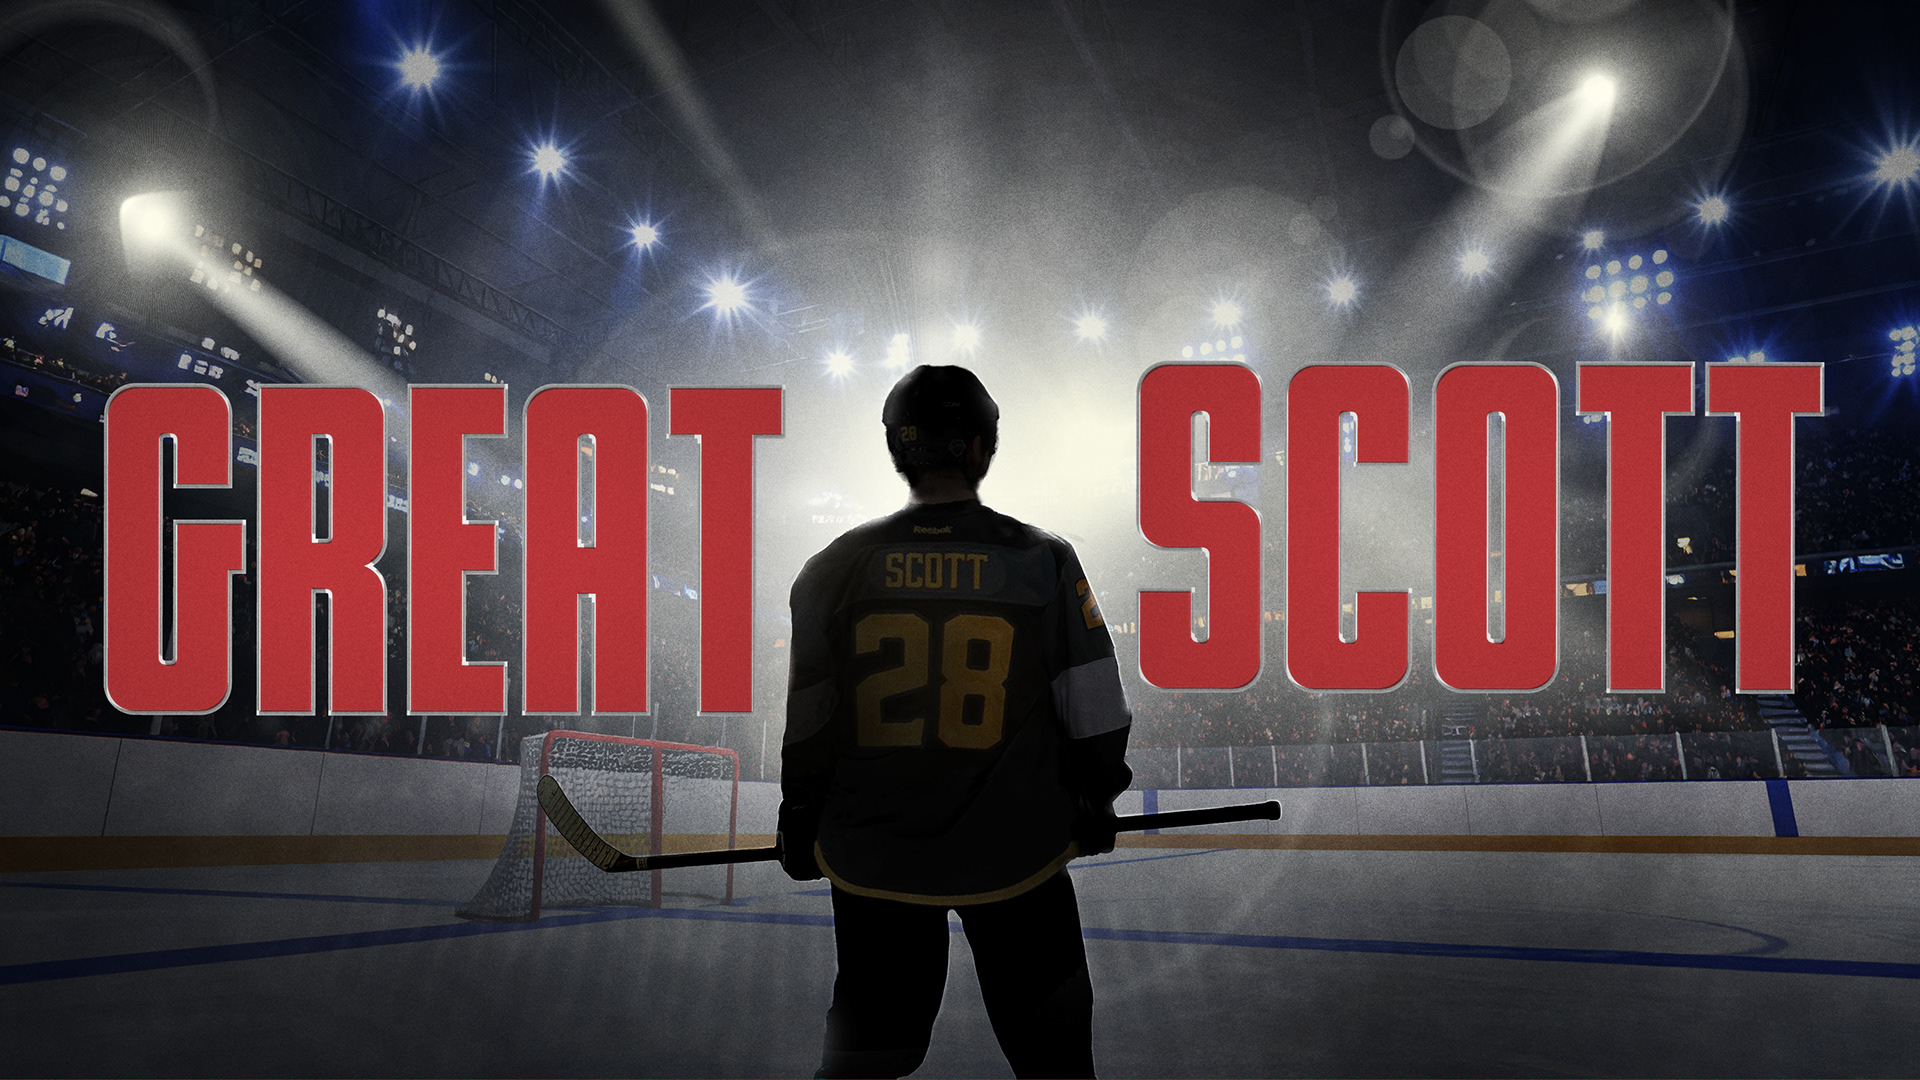
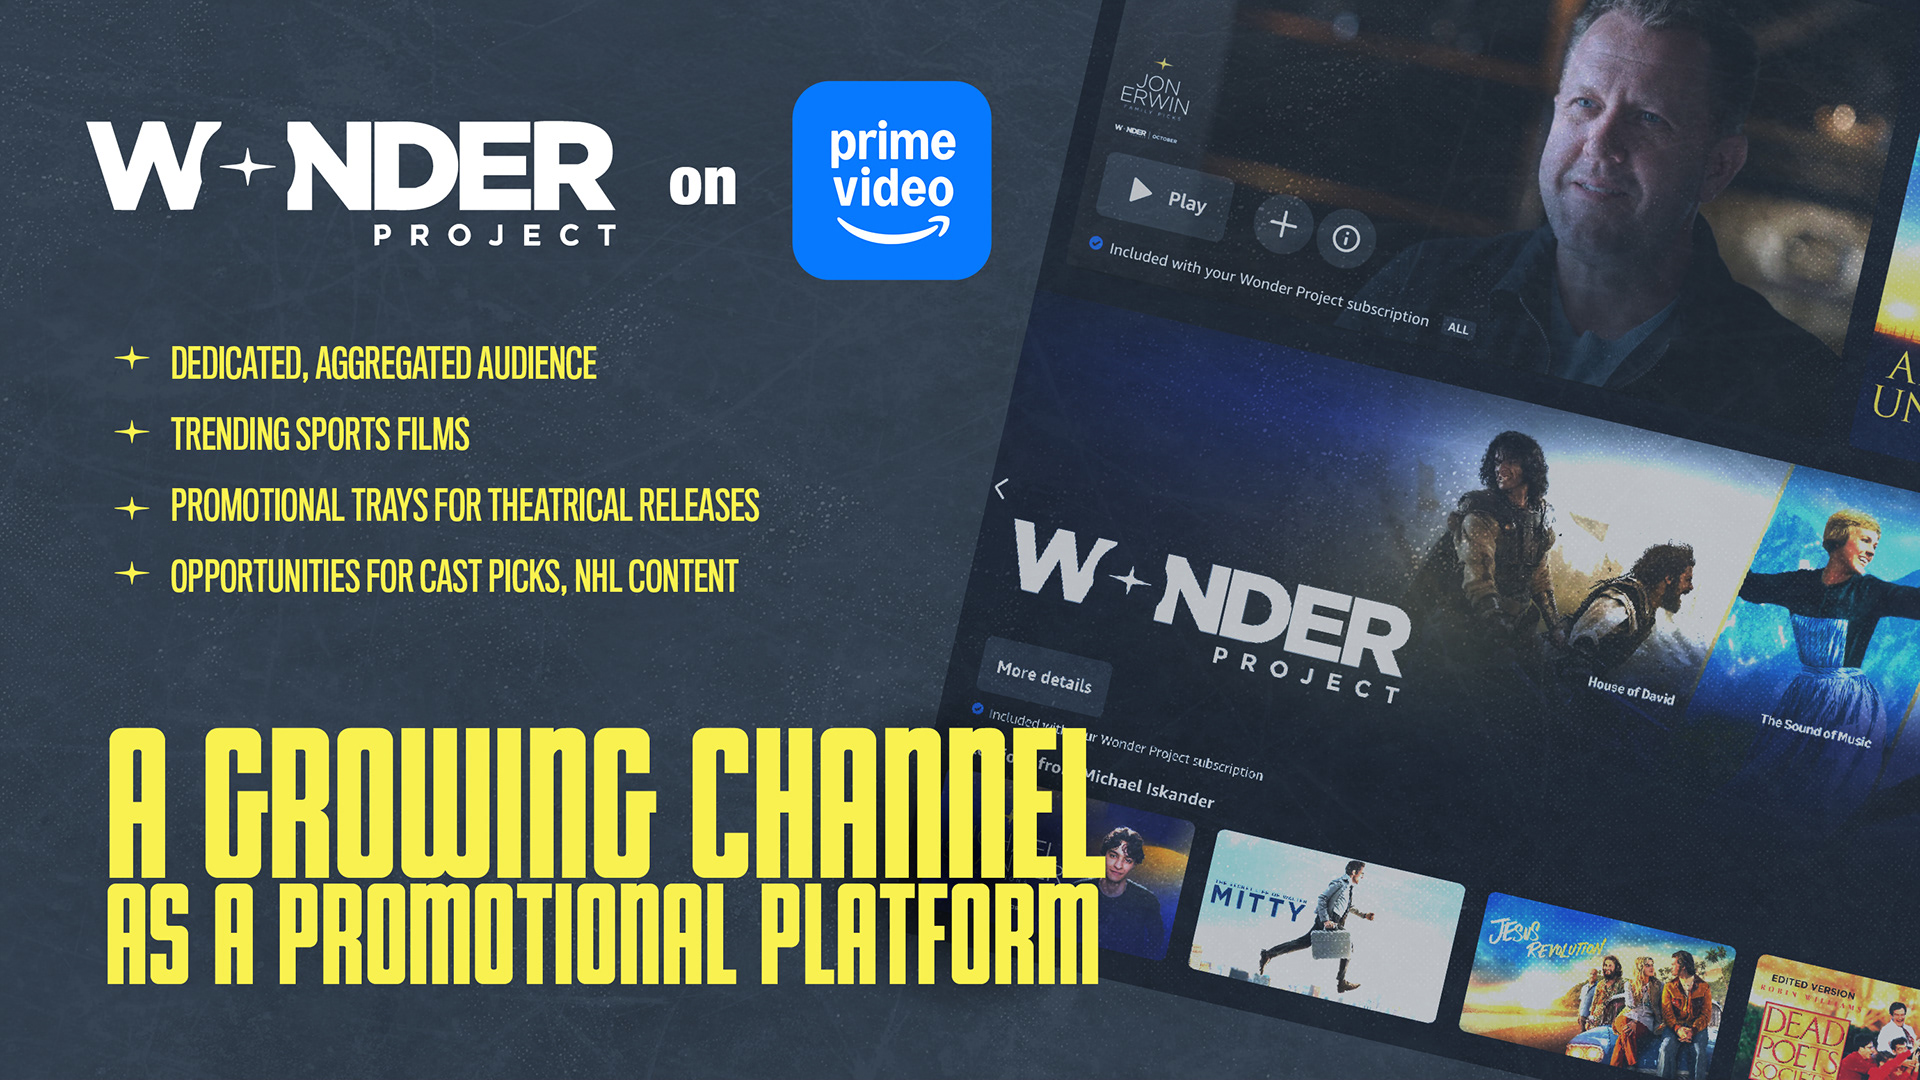
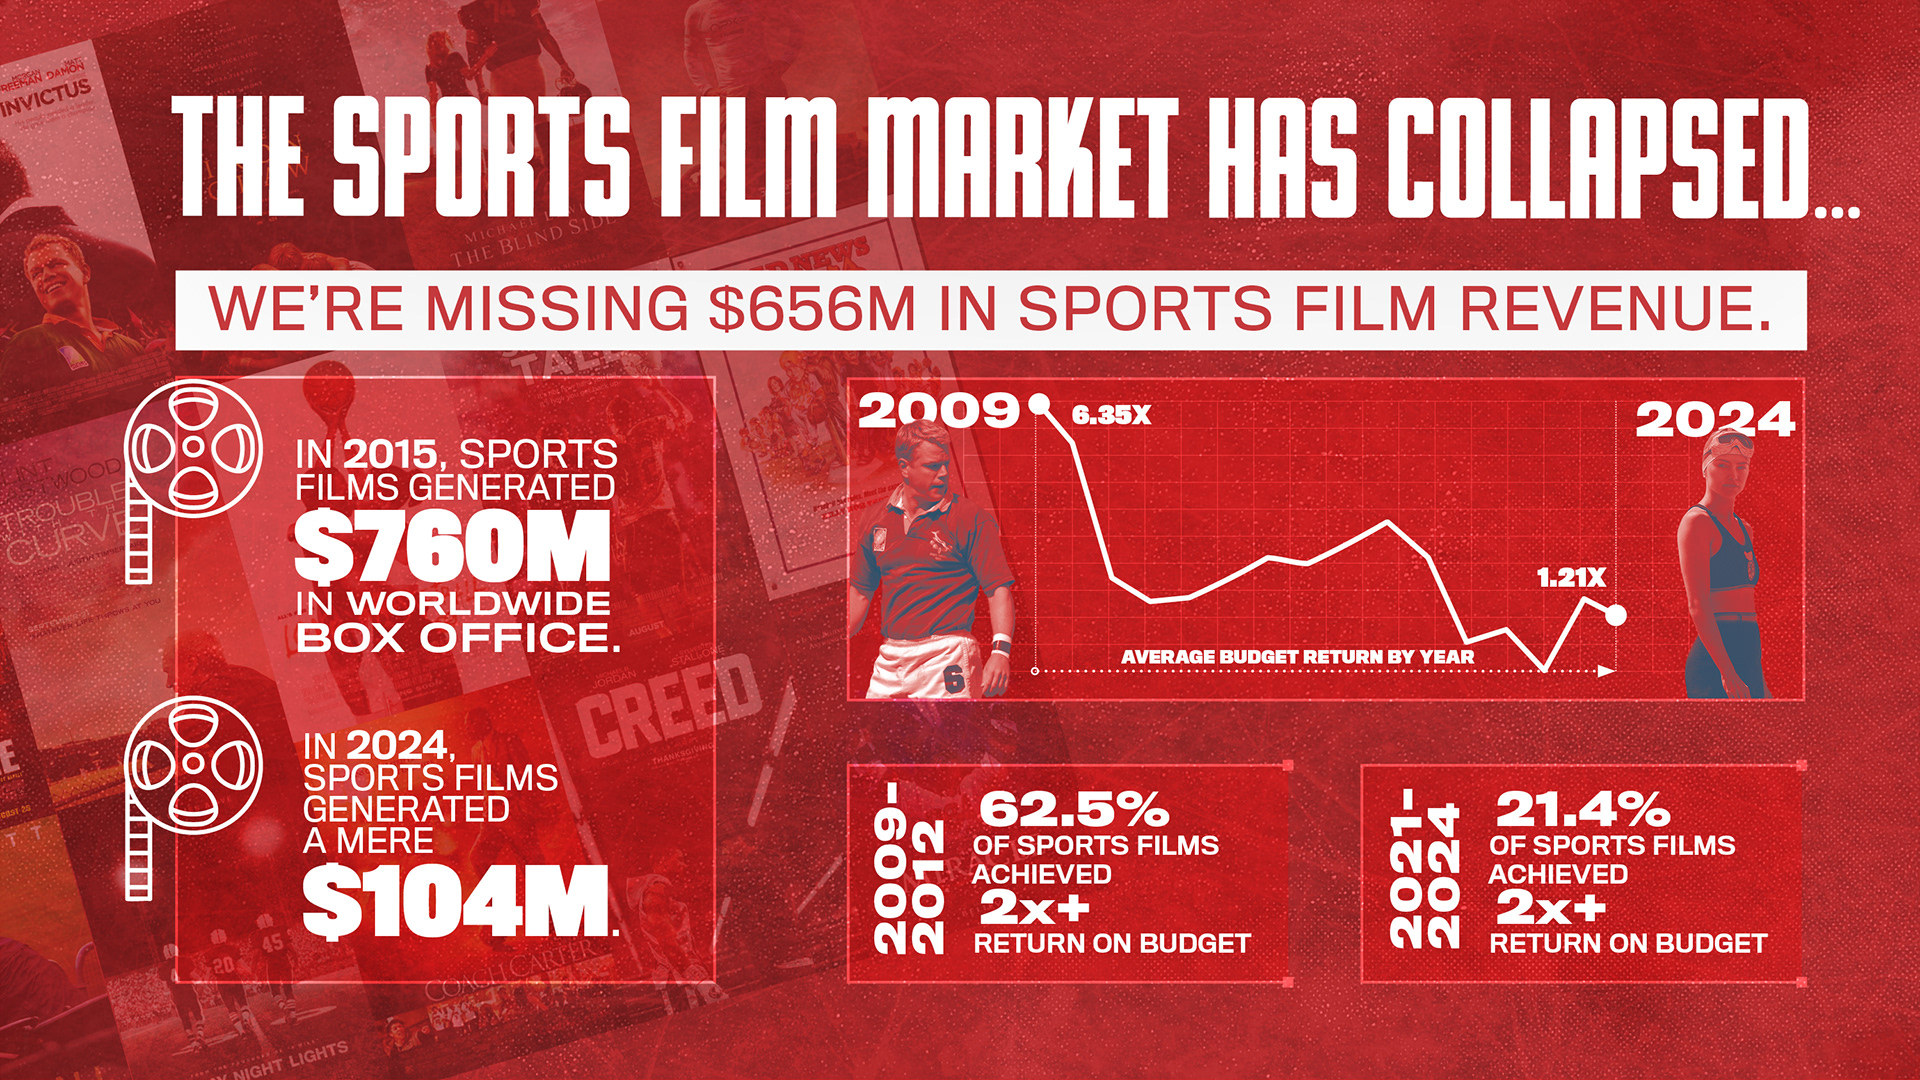
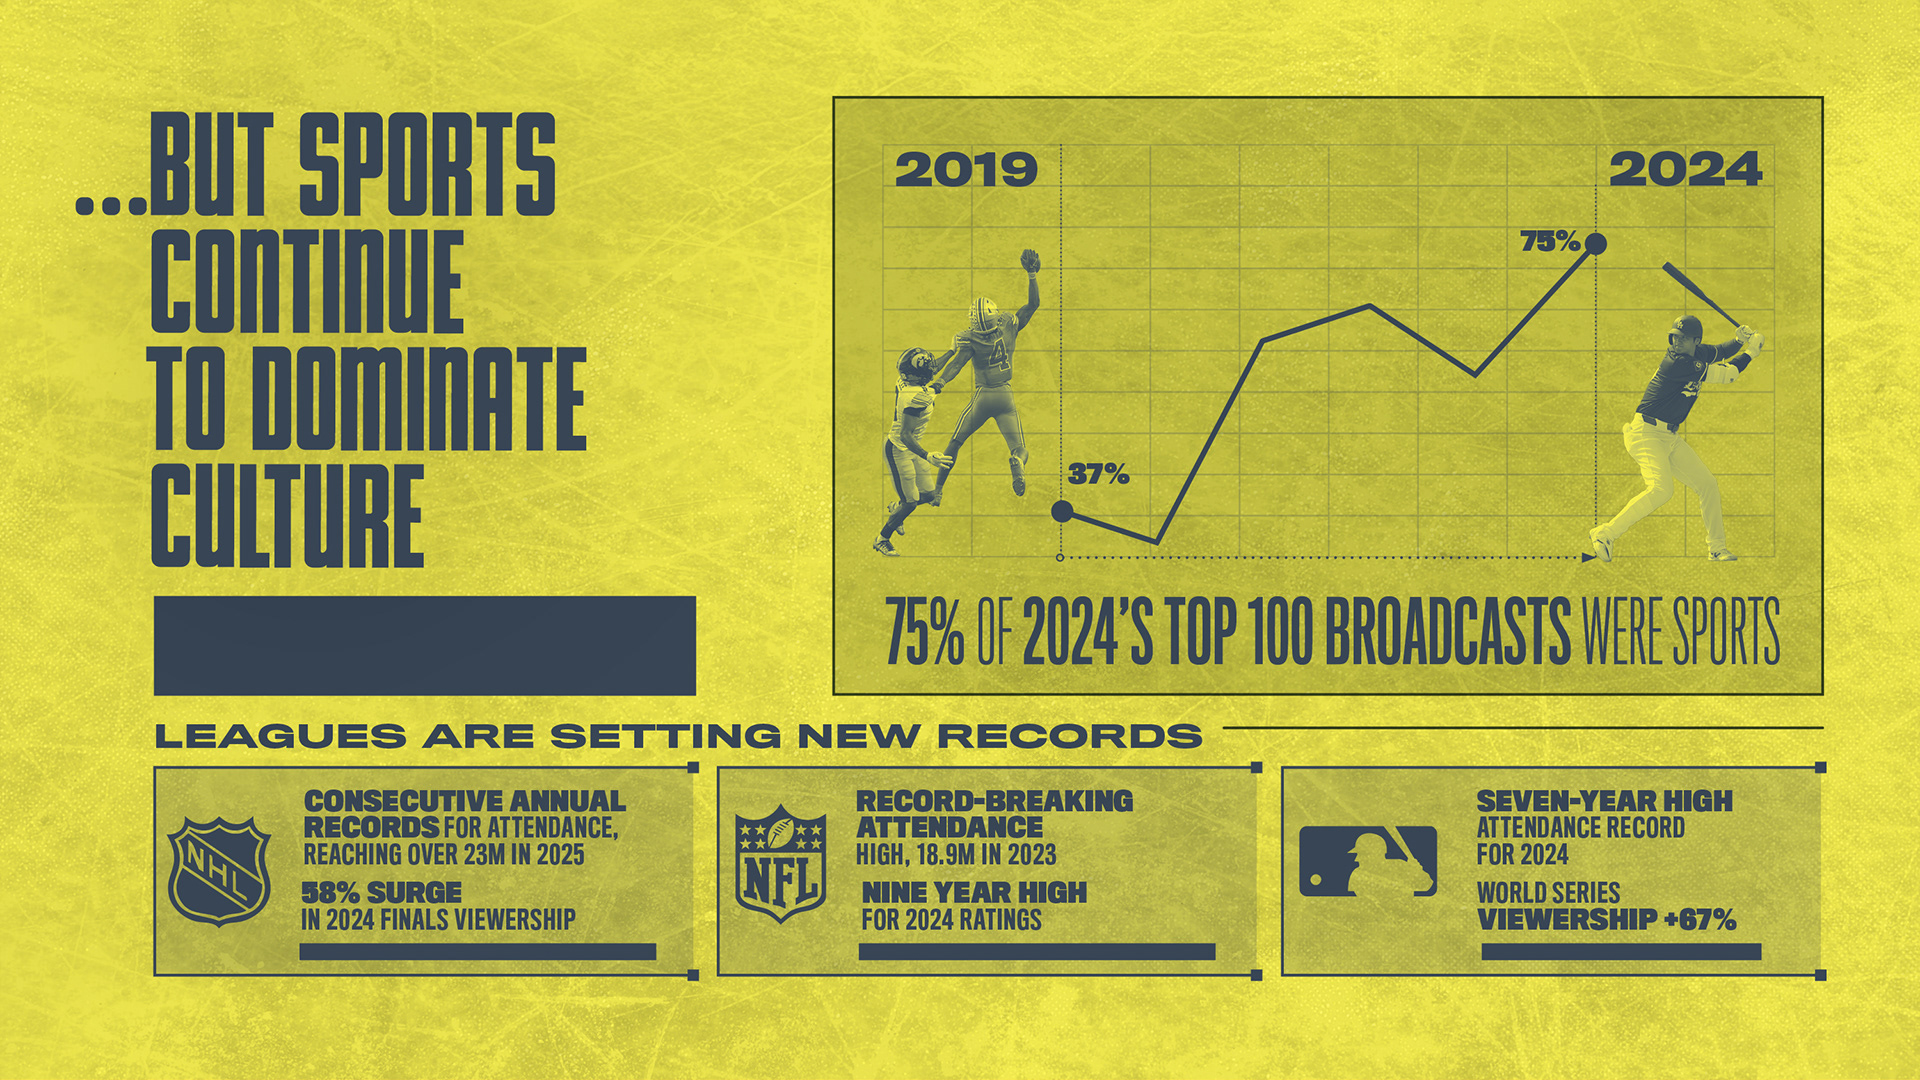
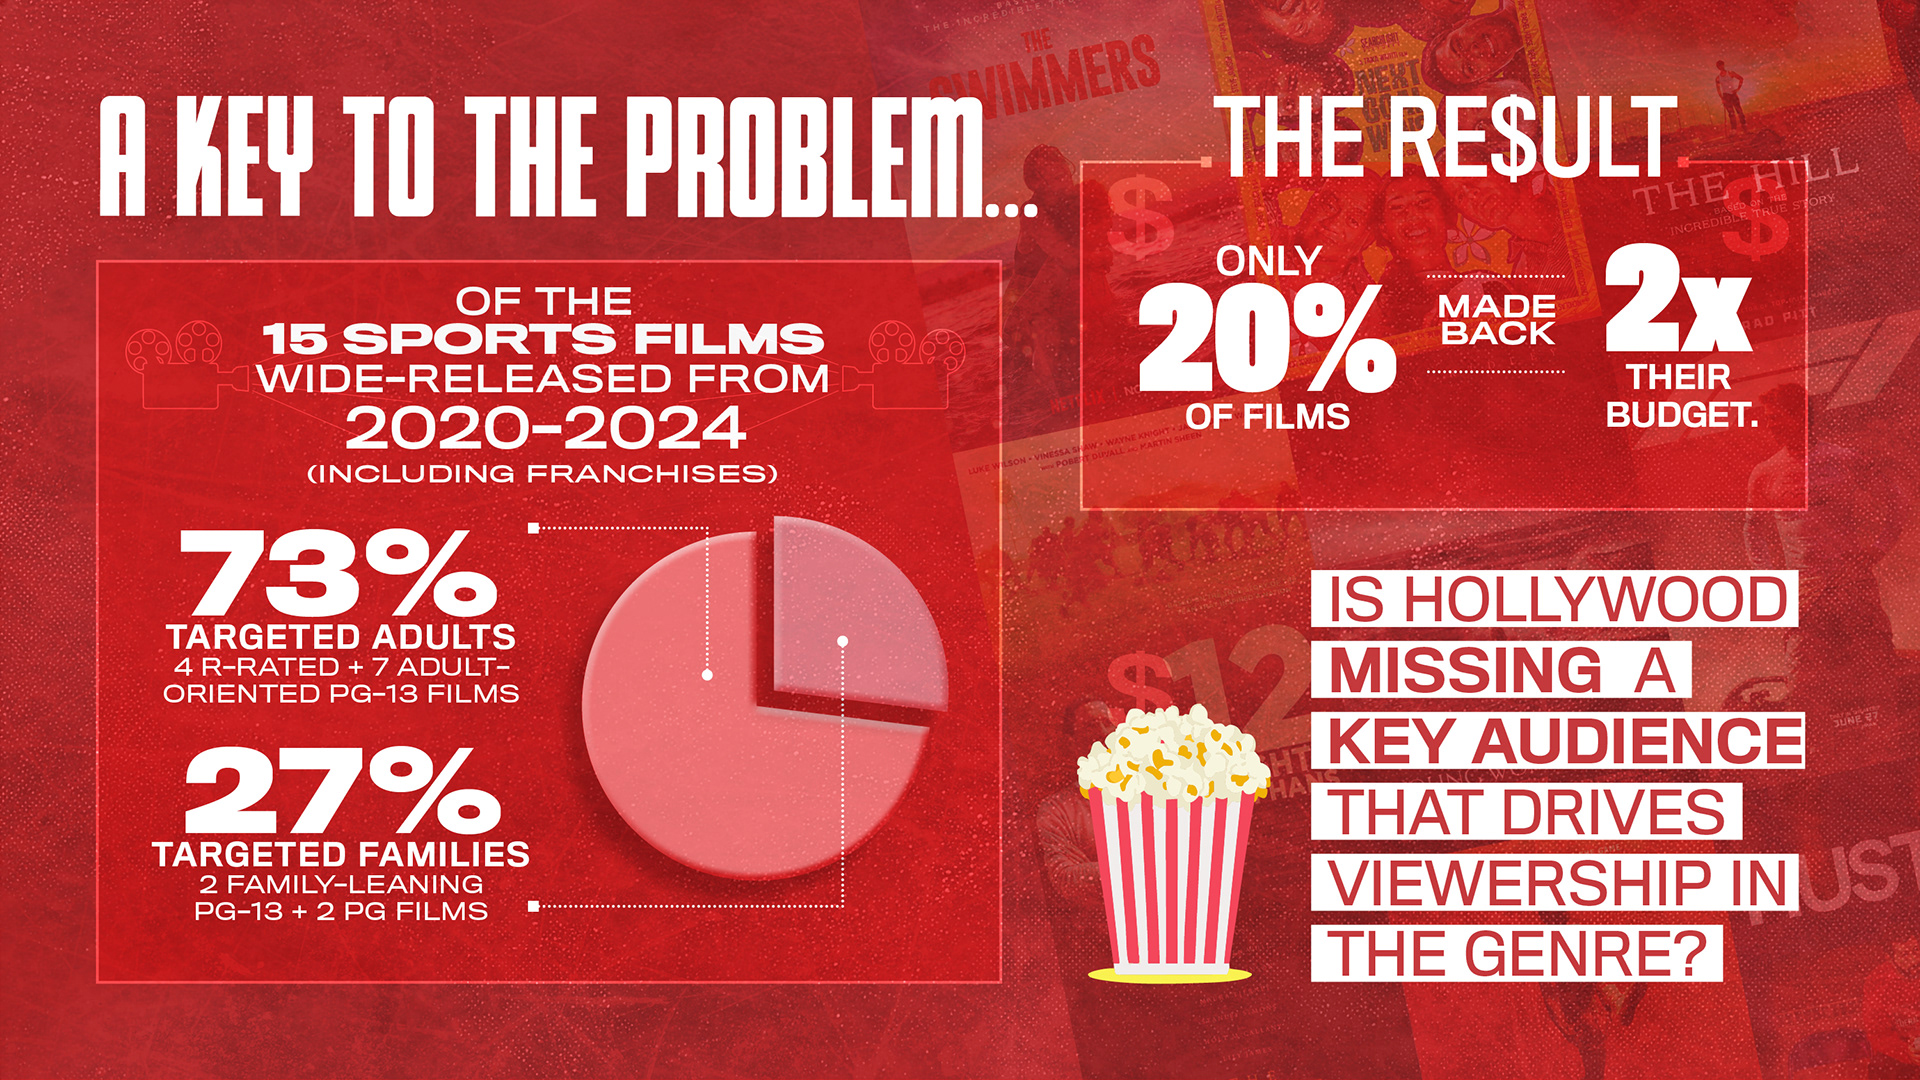
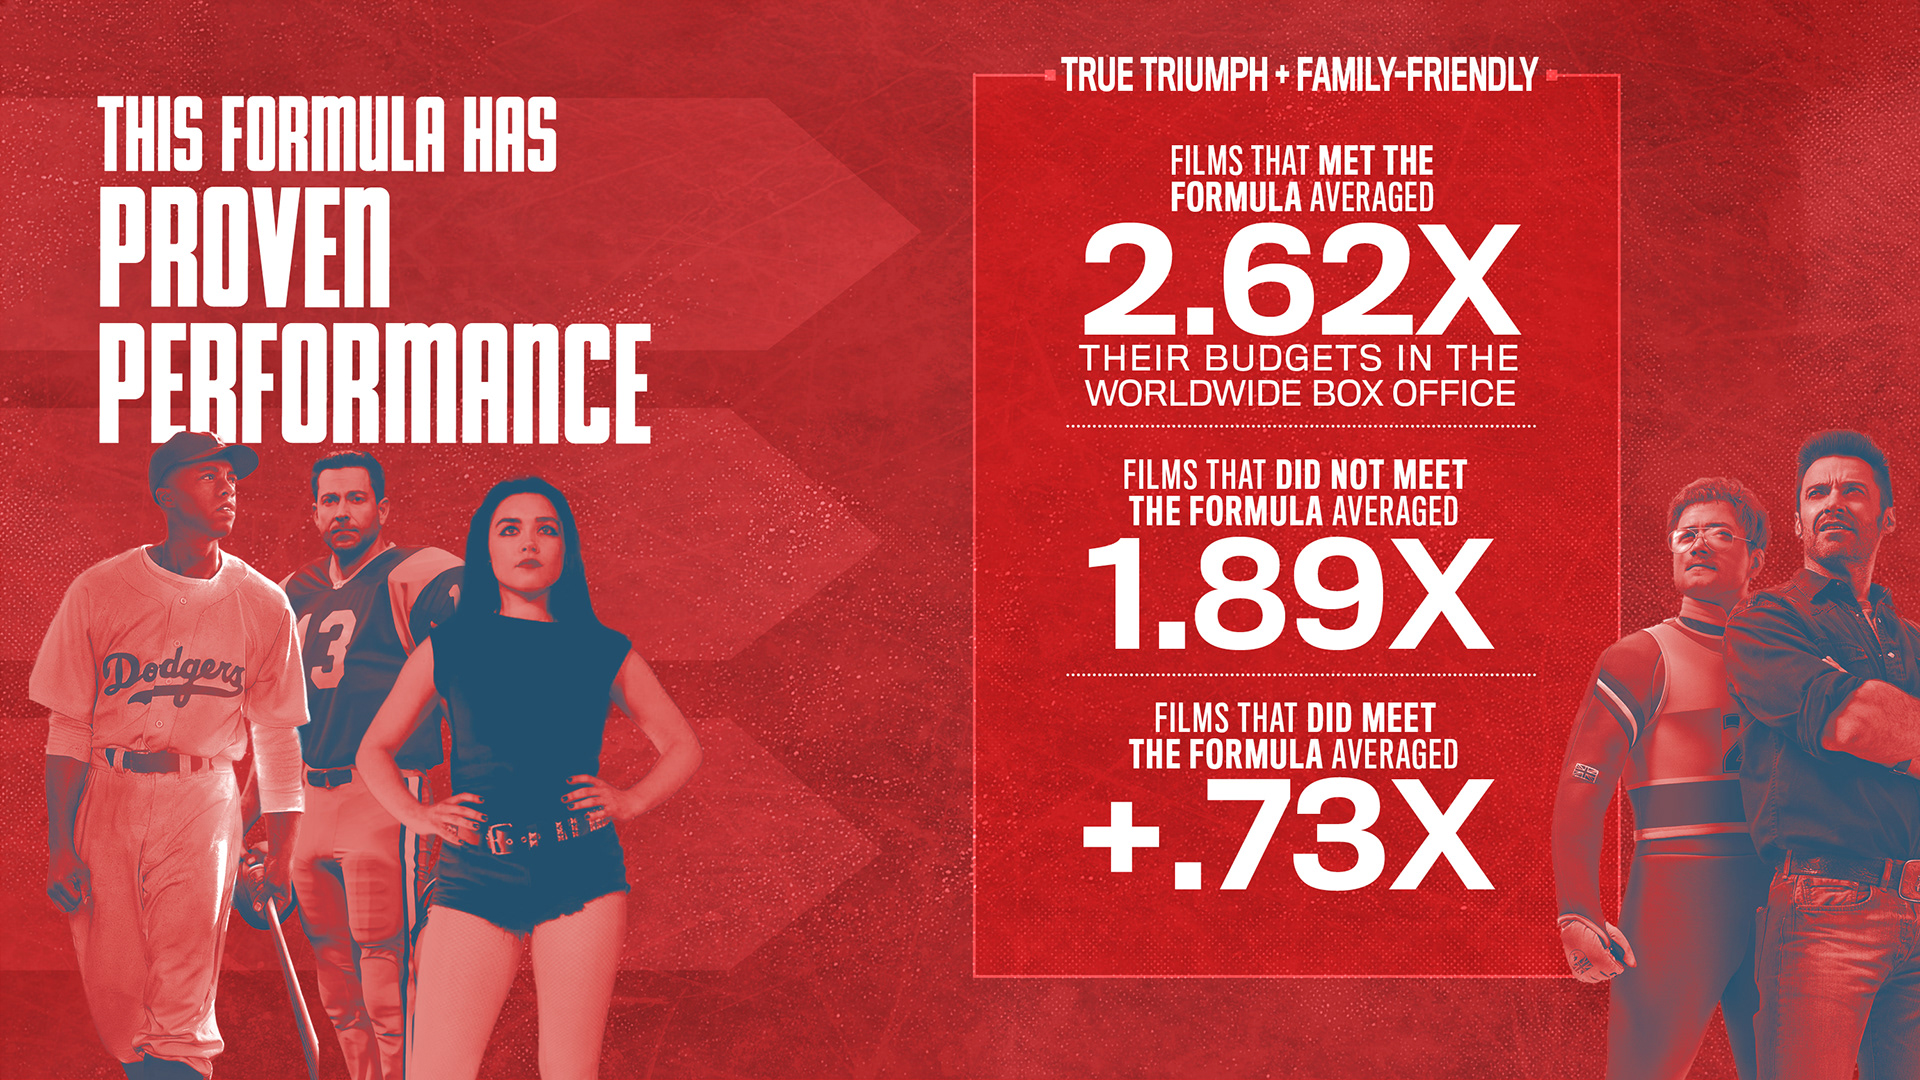
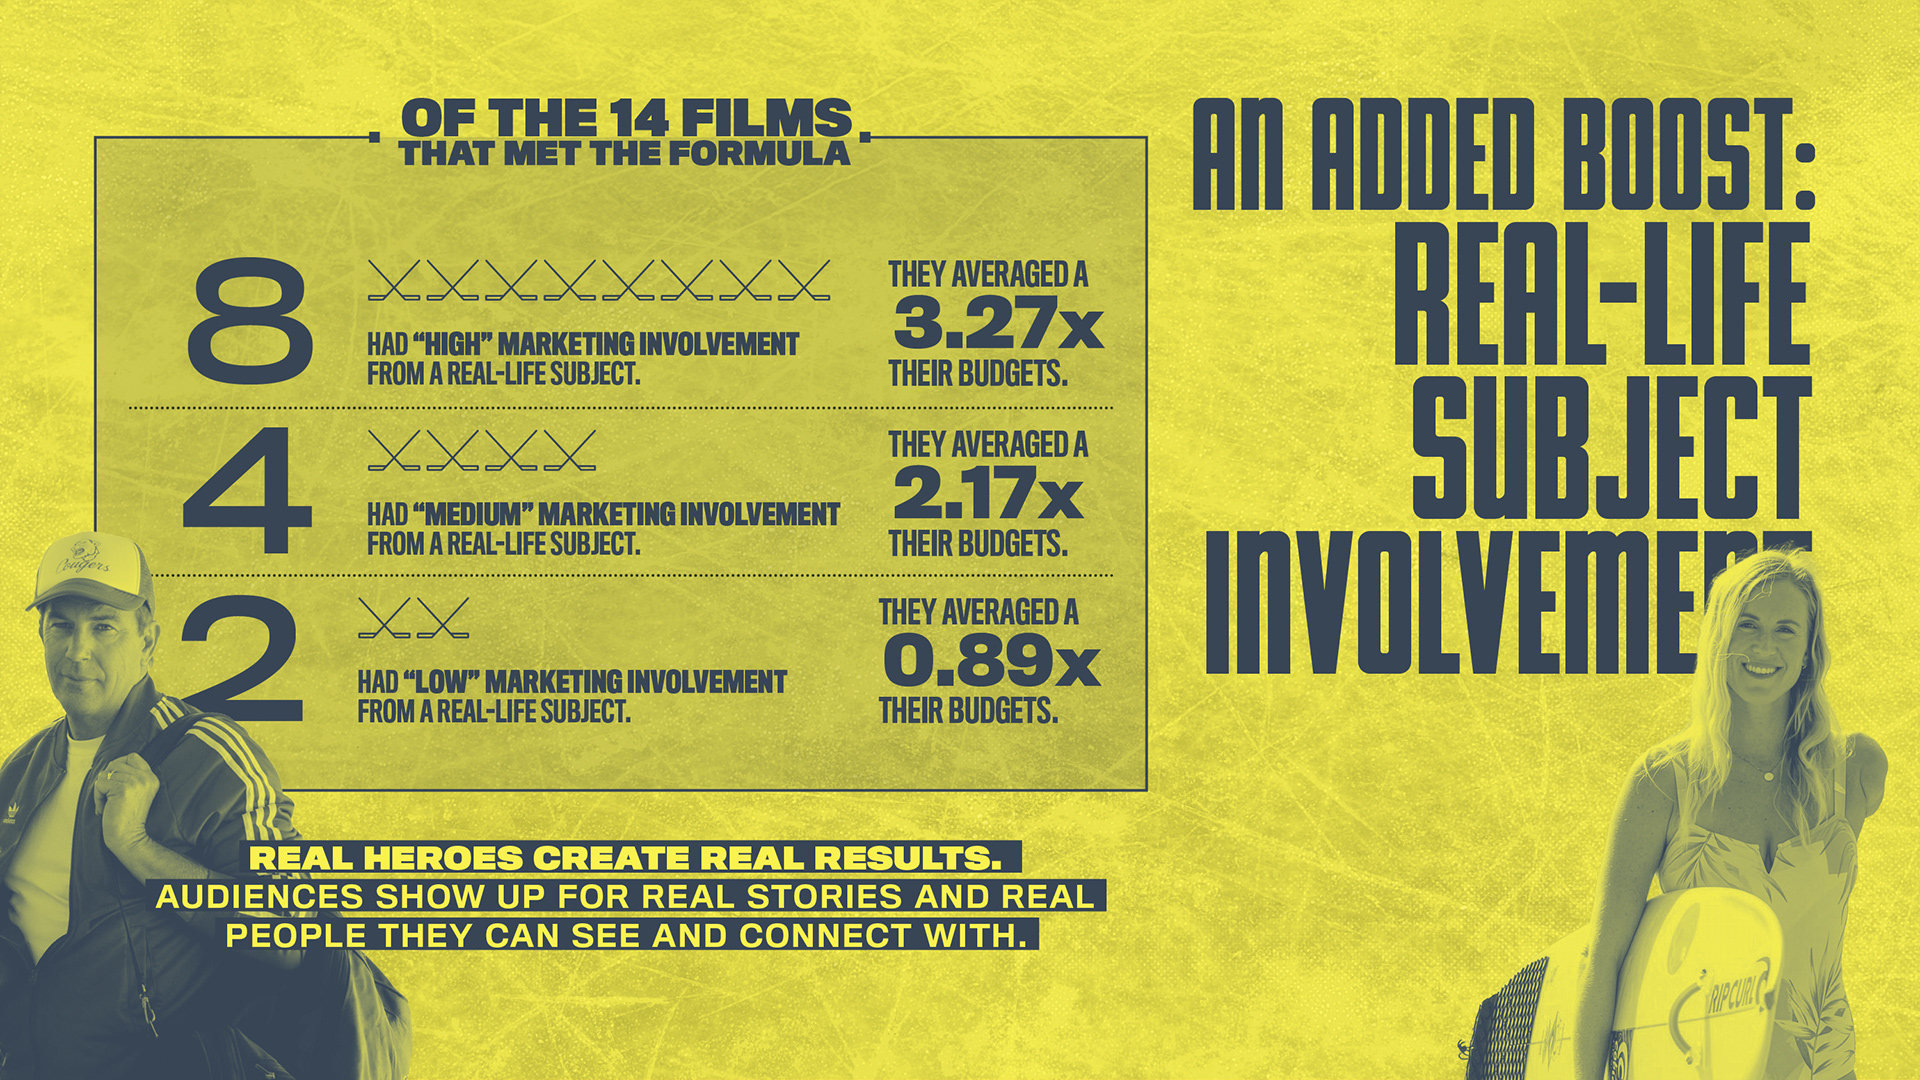
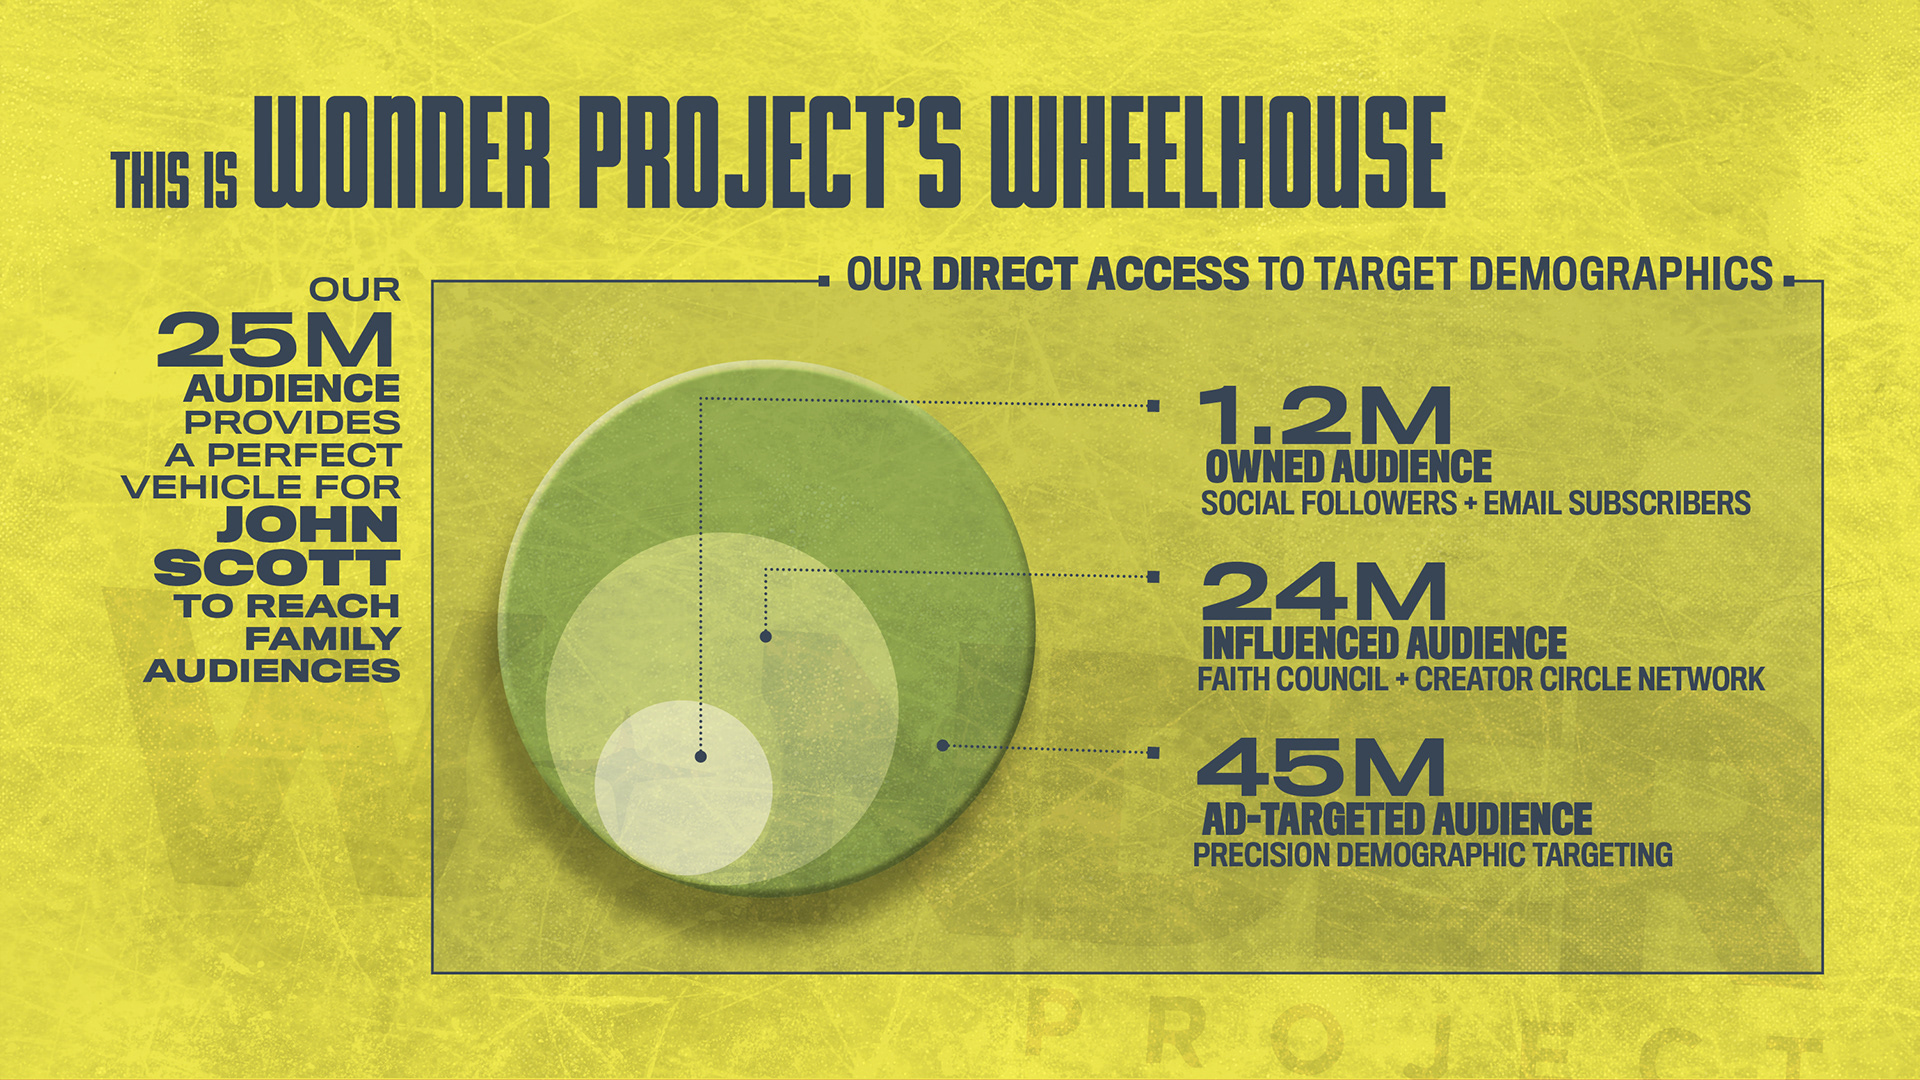
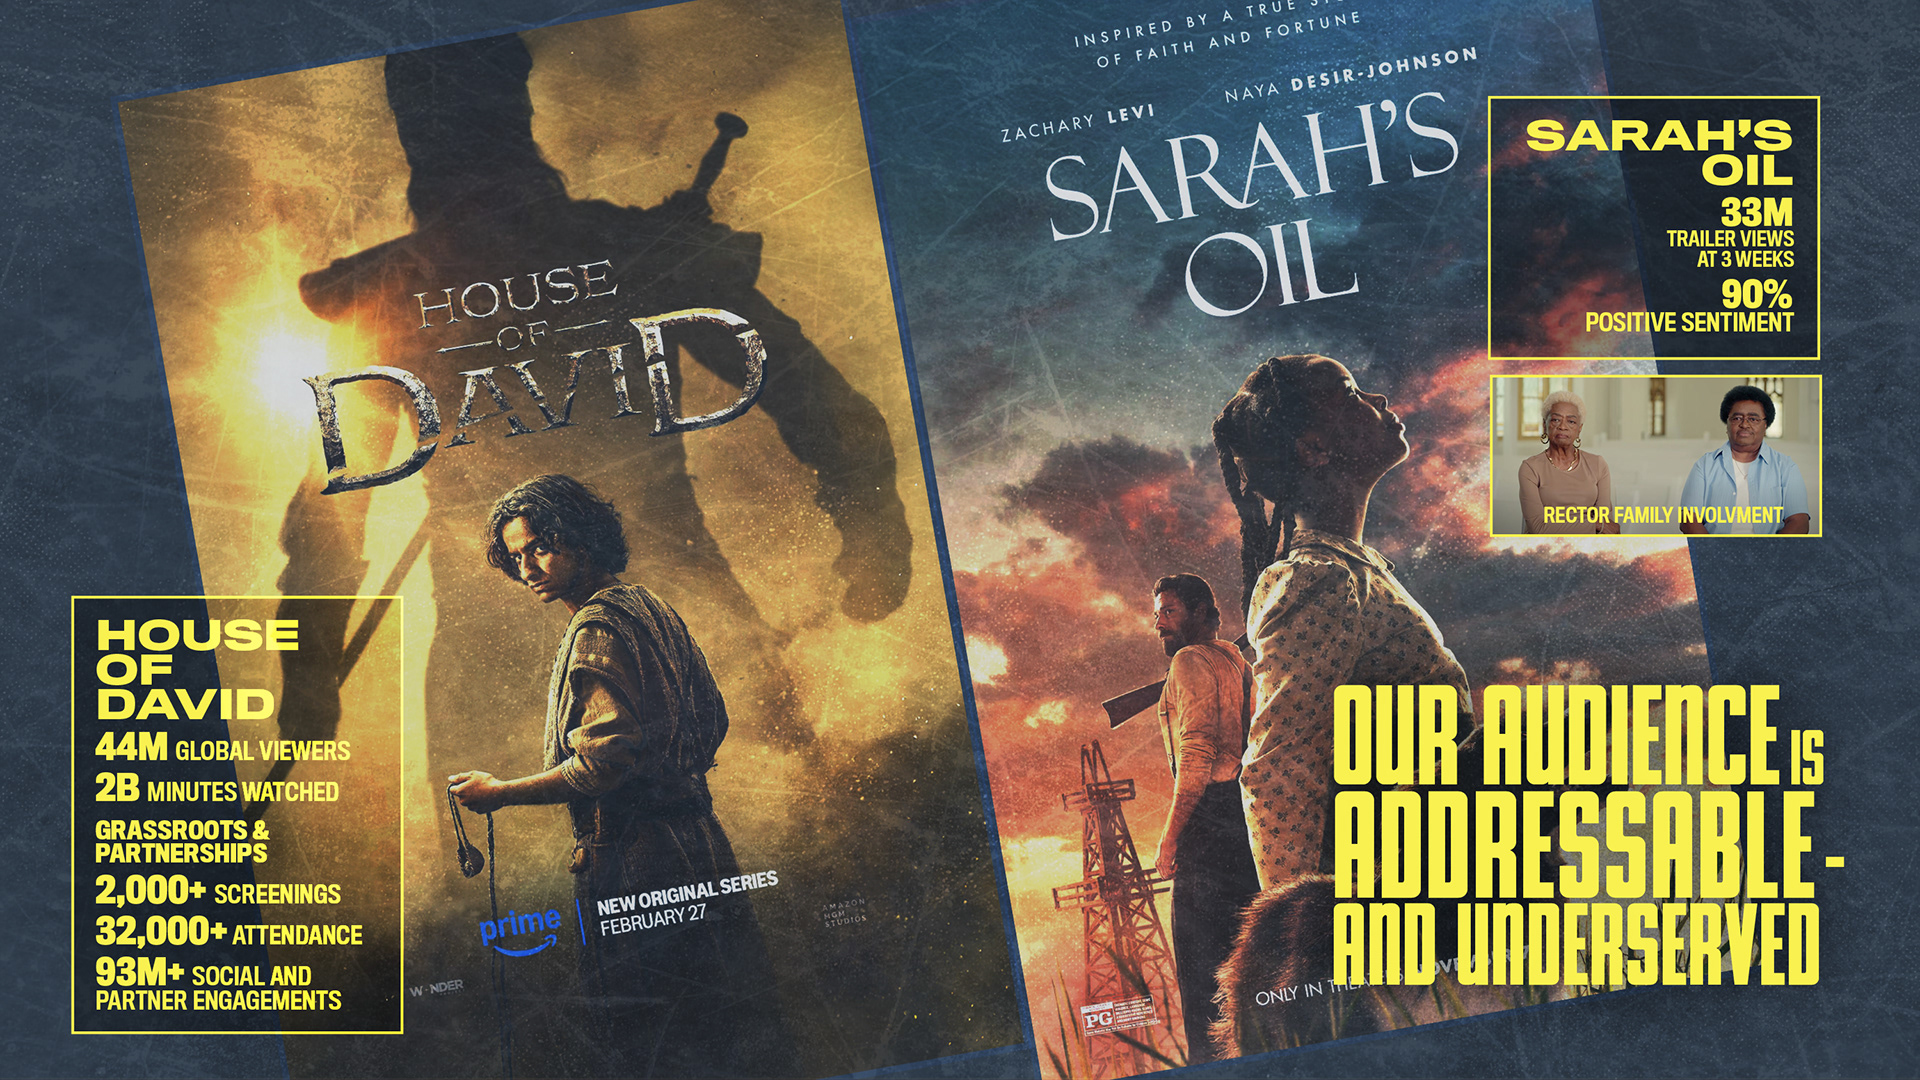
Design a cinematic, high-stakes pitch deck for The Wonder Project to secure a production deal with Amazon MGM Studios for Great Scott. The challenge was to marry a grit-and-glory underdog narrative with a rigorous, data-driven business case, proving the untapped financial potential of the sports biopic genre through aggressive market analytics.
STRATEGY
I developed a “stadium-ready” visual identity that utilizes dynamic data storytelling to anchor the investment pitch. By transforming dense industry metrics—such as the “collapsed sports film market” and ROI projections—into high-impact, full-bleed infographics, I made the financial argument impossible to ignore. Pairing a bold, patriotic color palette with custom-illustrated charts and aggressive typography, I positioned the project as a precise, data-backed solution to a major market gap, ensuring the business case felt just as visceral as the film’s narrative arc.
CLIENT

BRAND AWARENESS CAMPAIGN
ONE SHEET POSTER CONCEPTS
ONE SHEET POSTER CONCEPTS
CONCEPT, LAYOUT, TYPOGRAPHY, PHOTO ILLUSTRATION,
COMPOSITING AND FINISHING
COMPOSITING AND FINISHING
PROJECT DATE | 2020
BRIEF
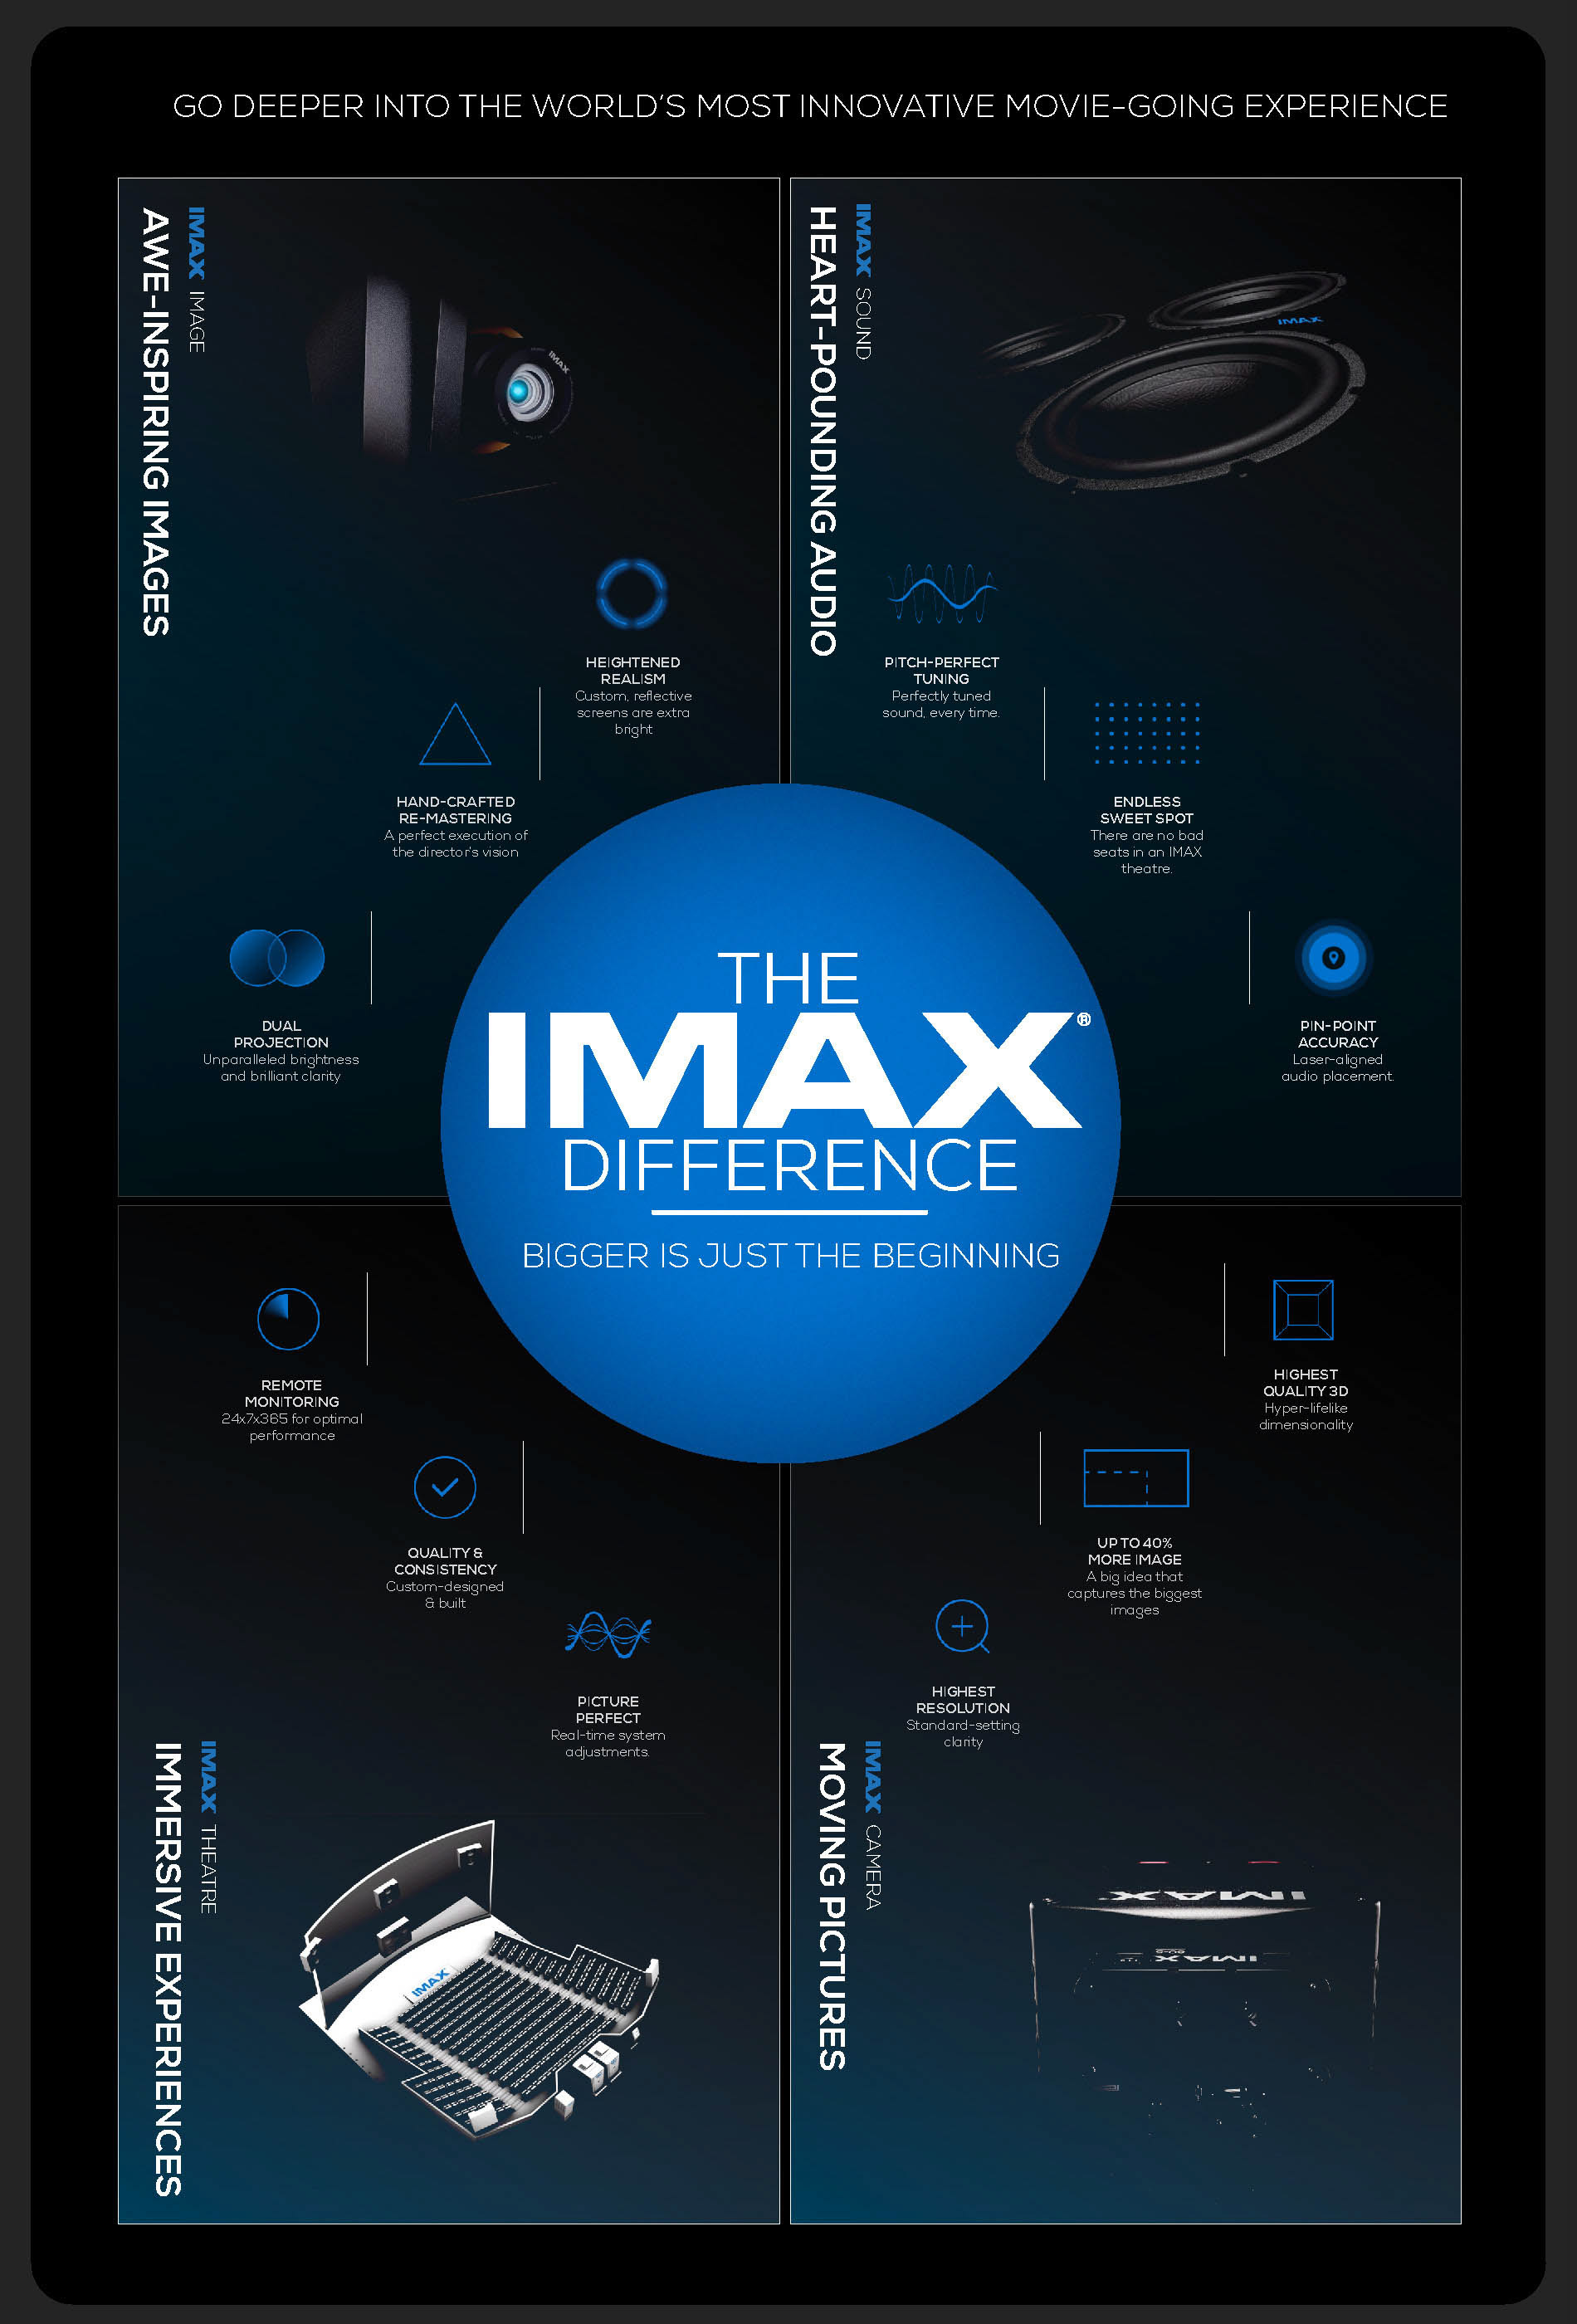
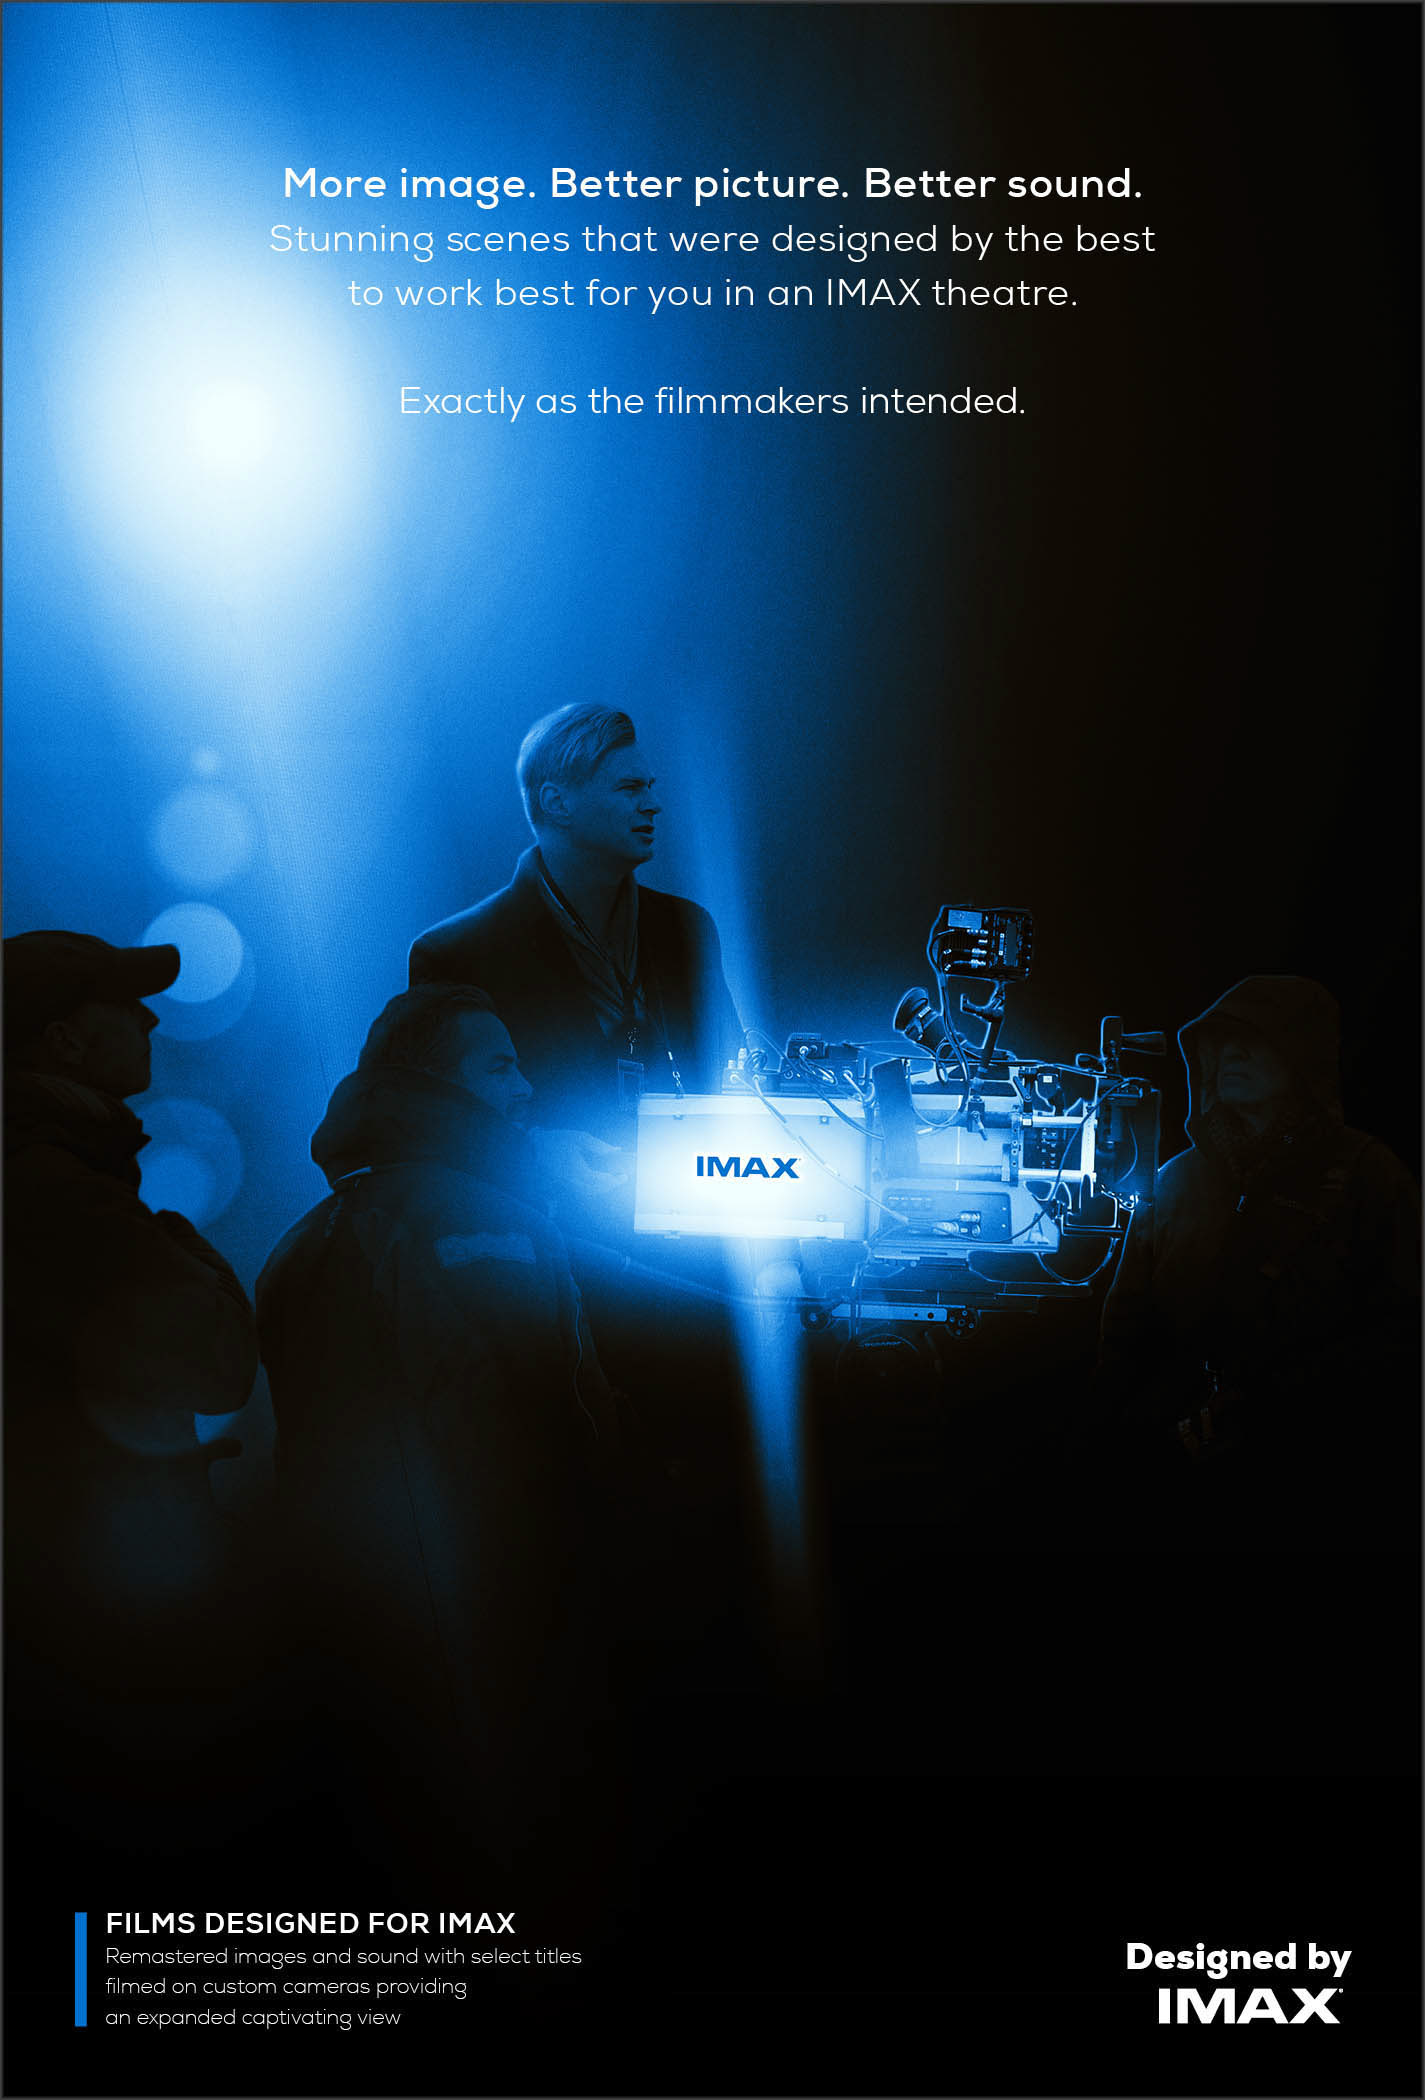
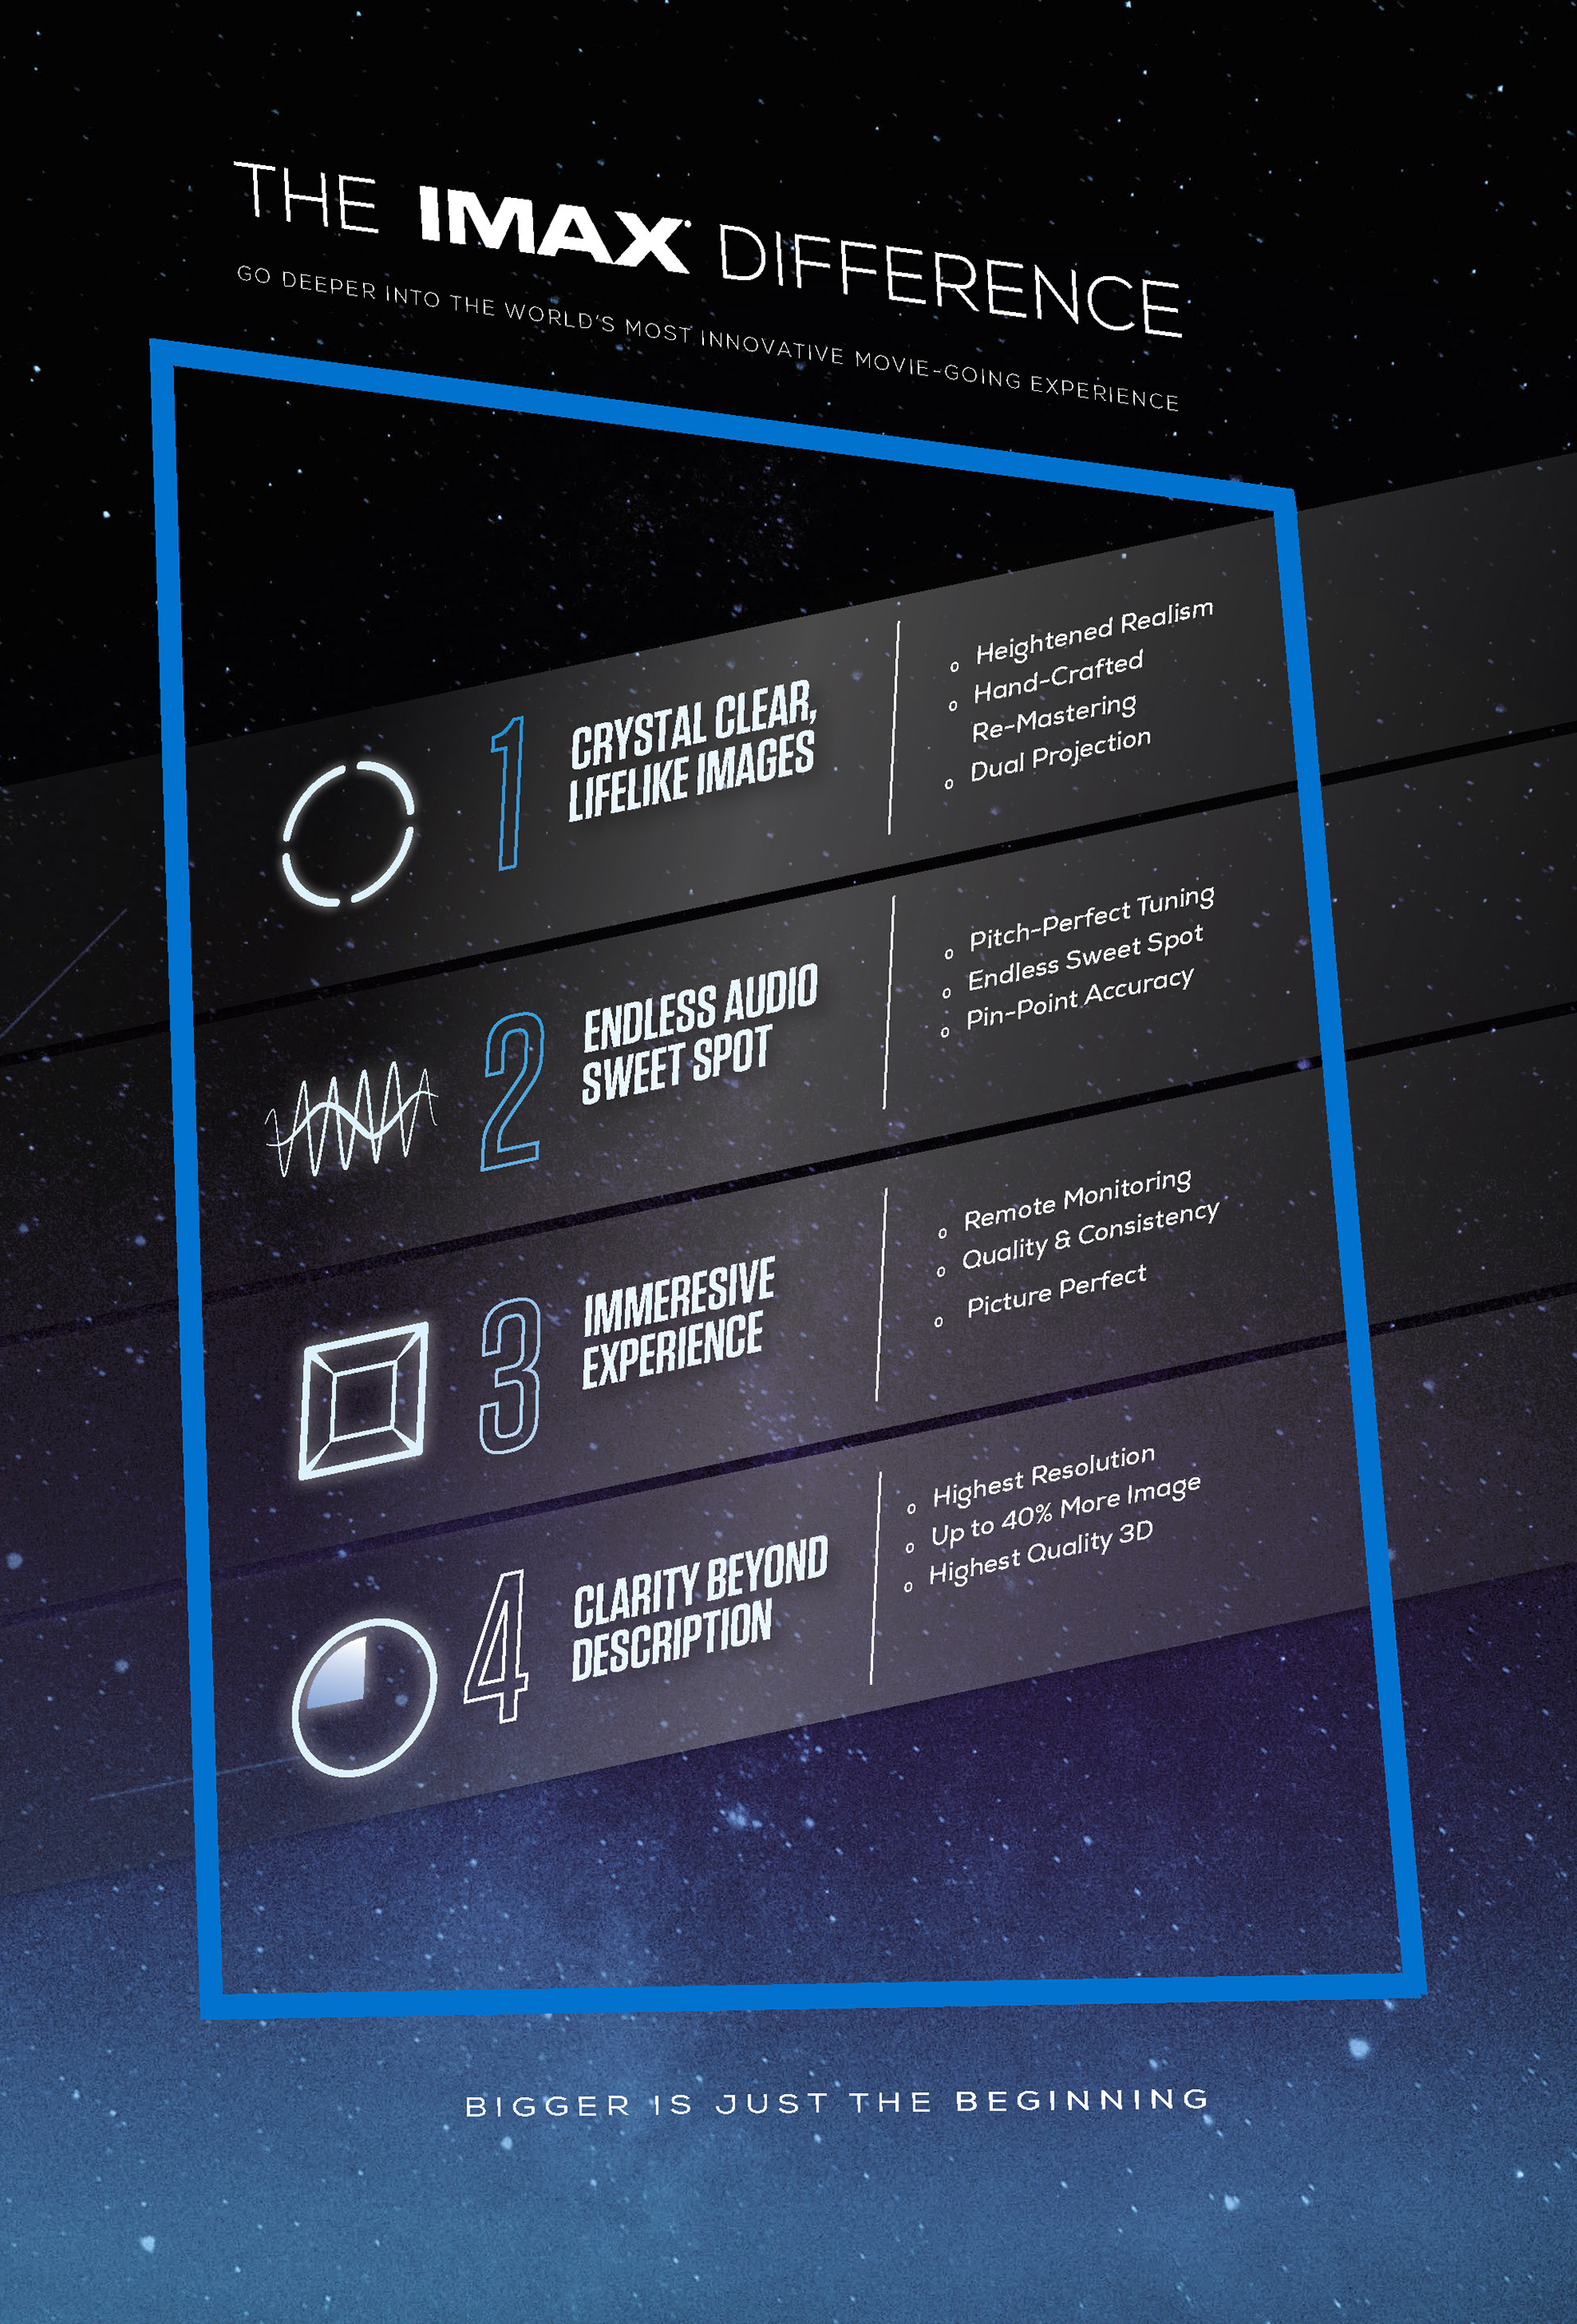
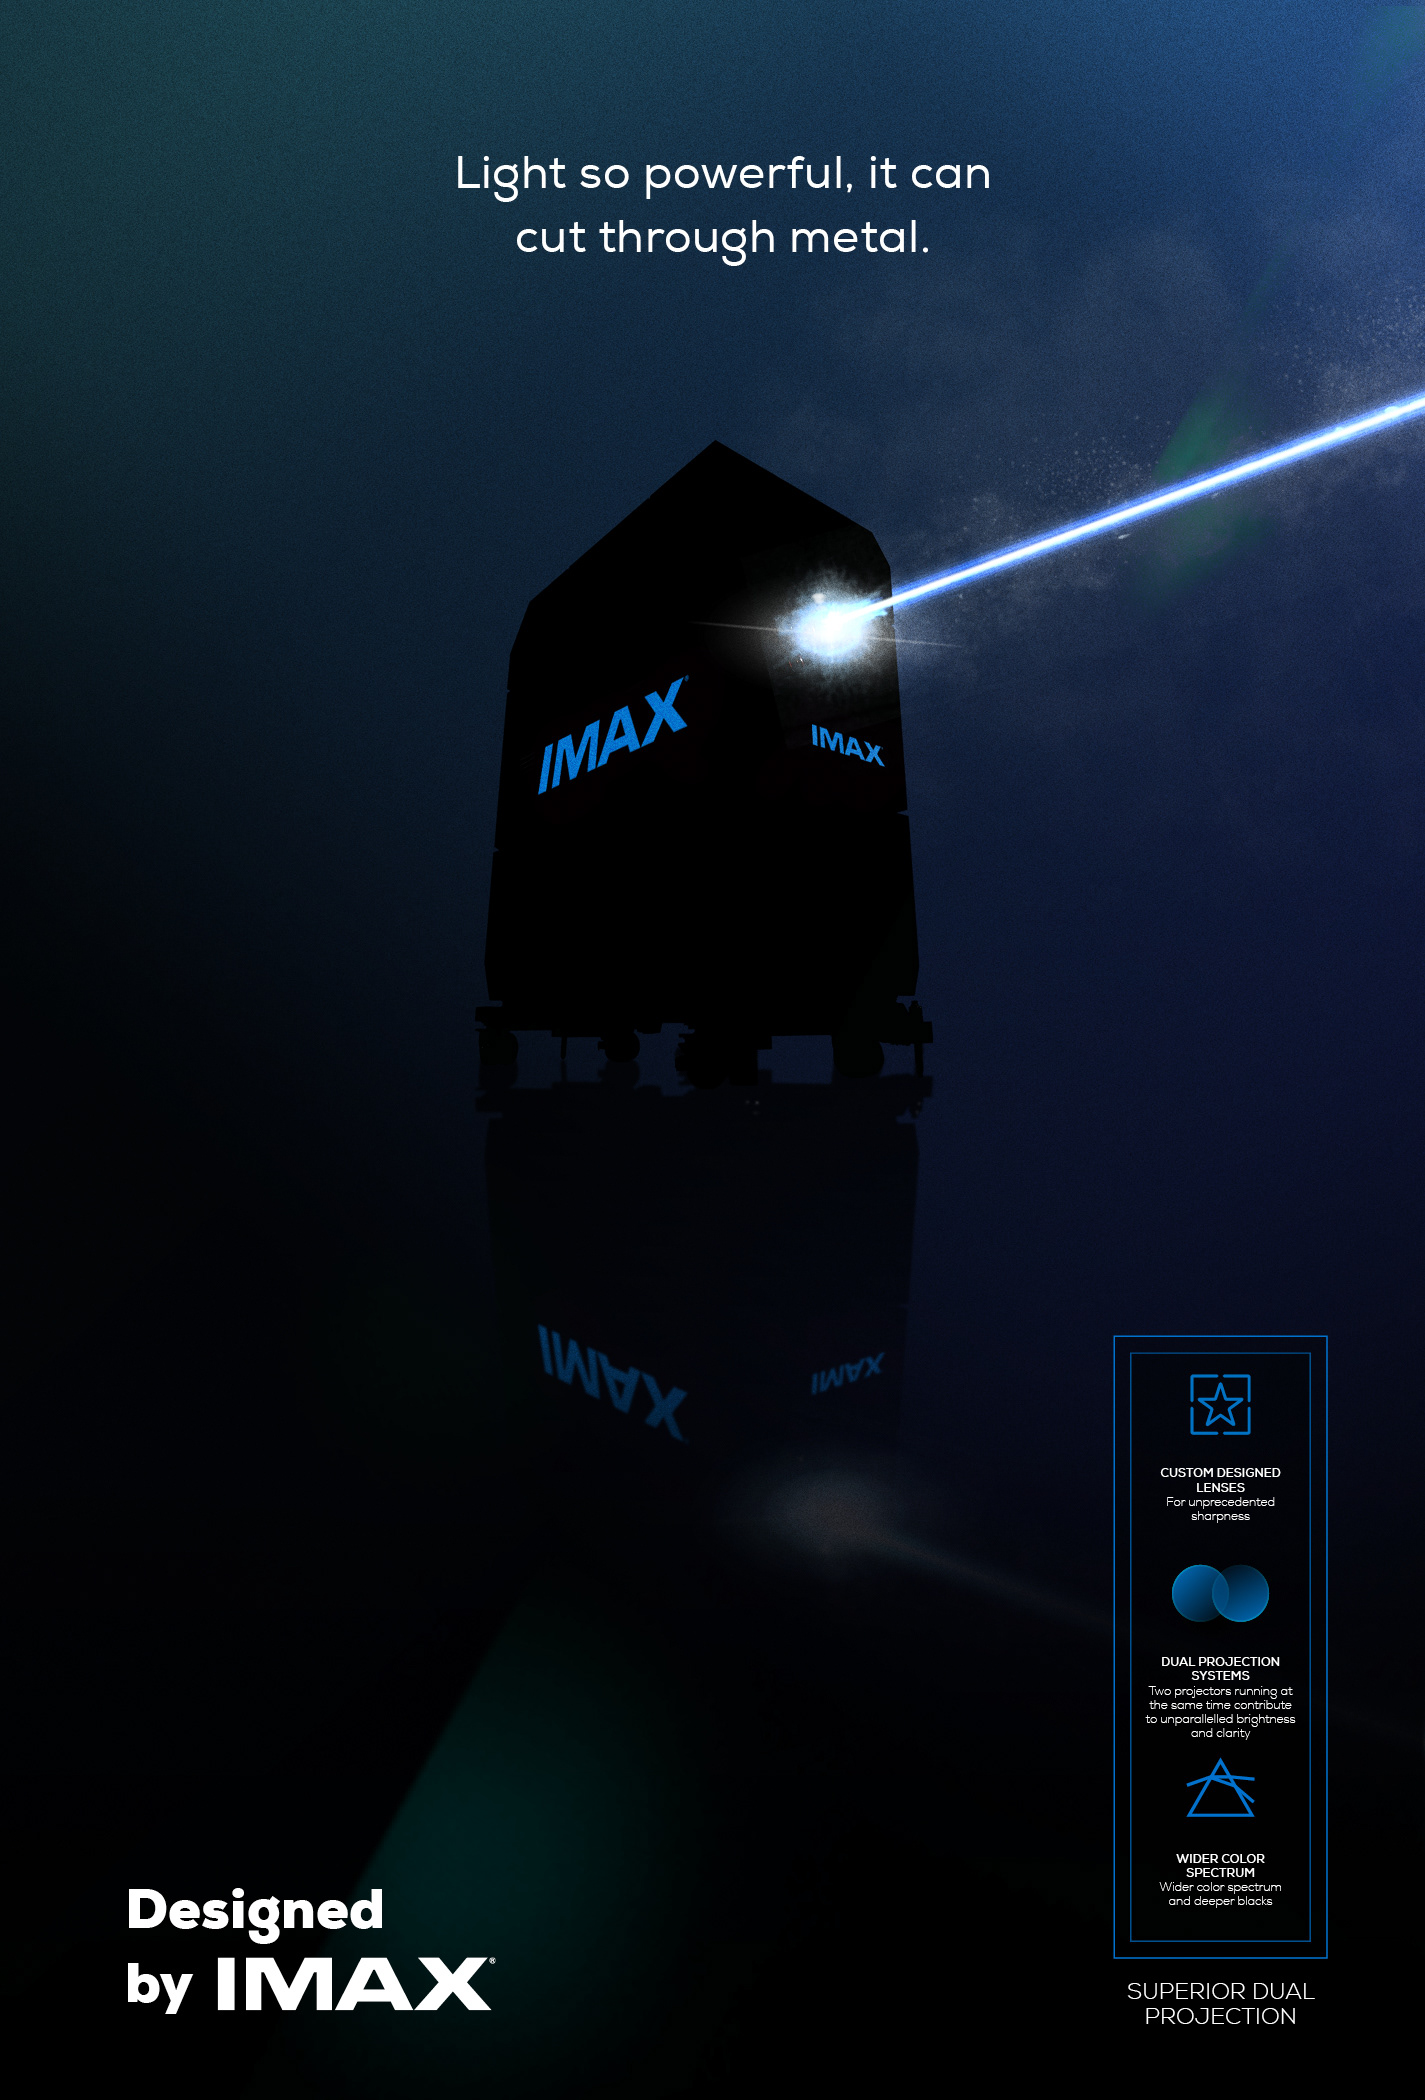
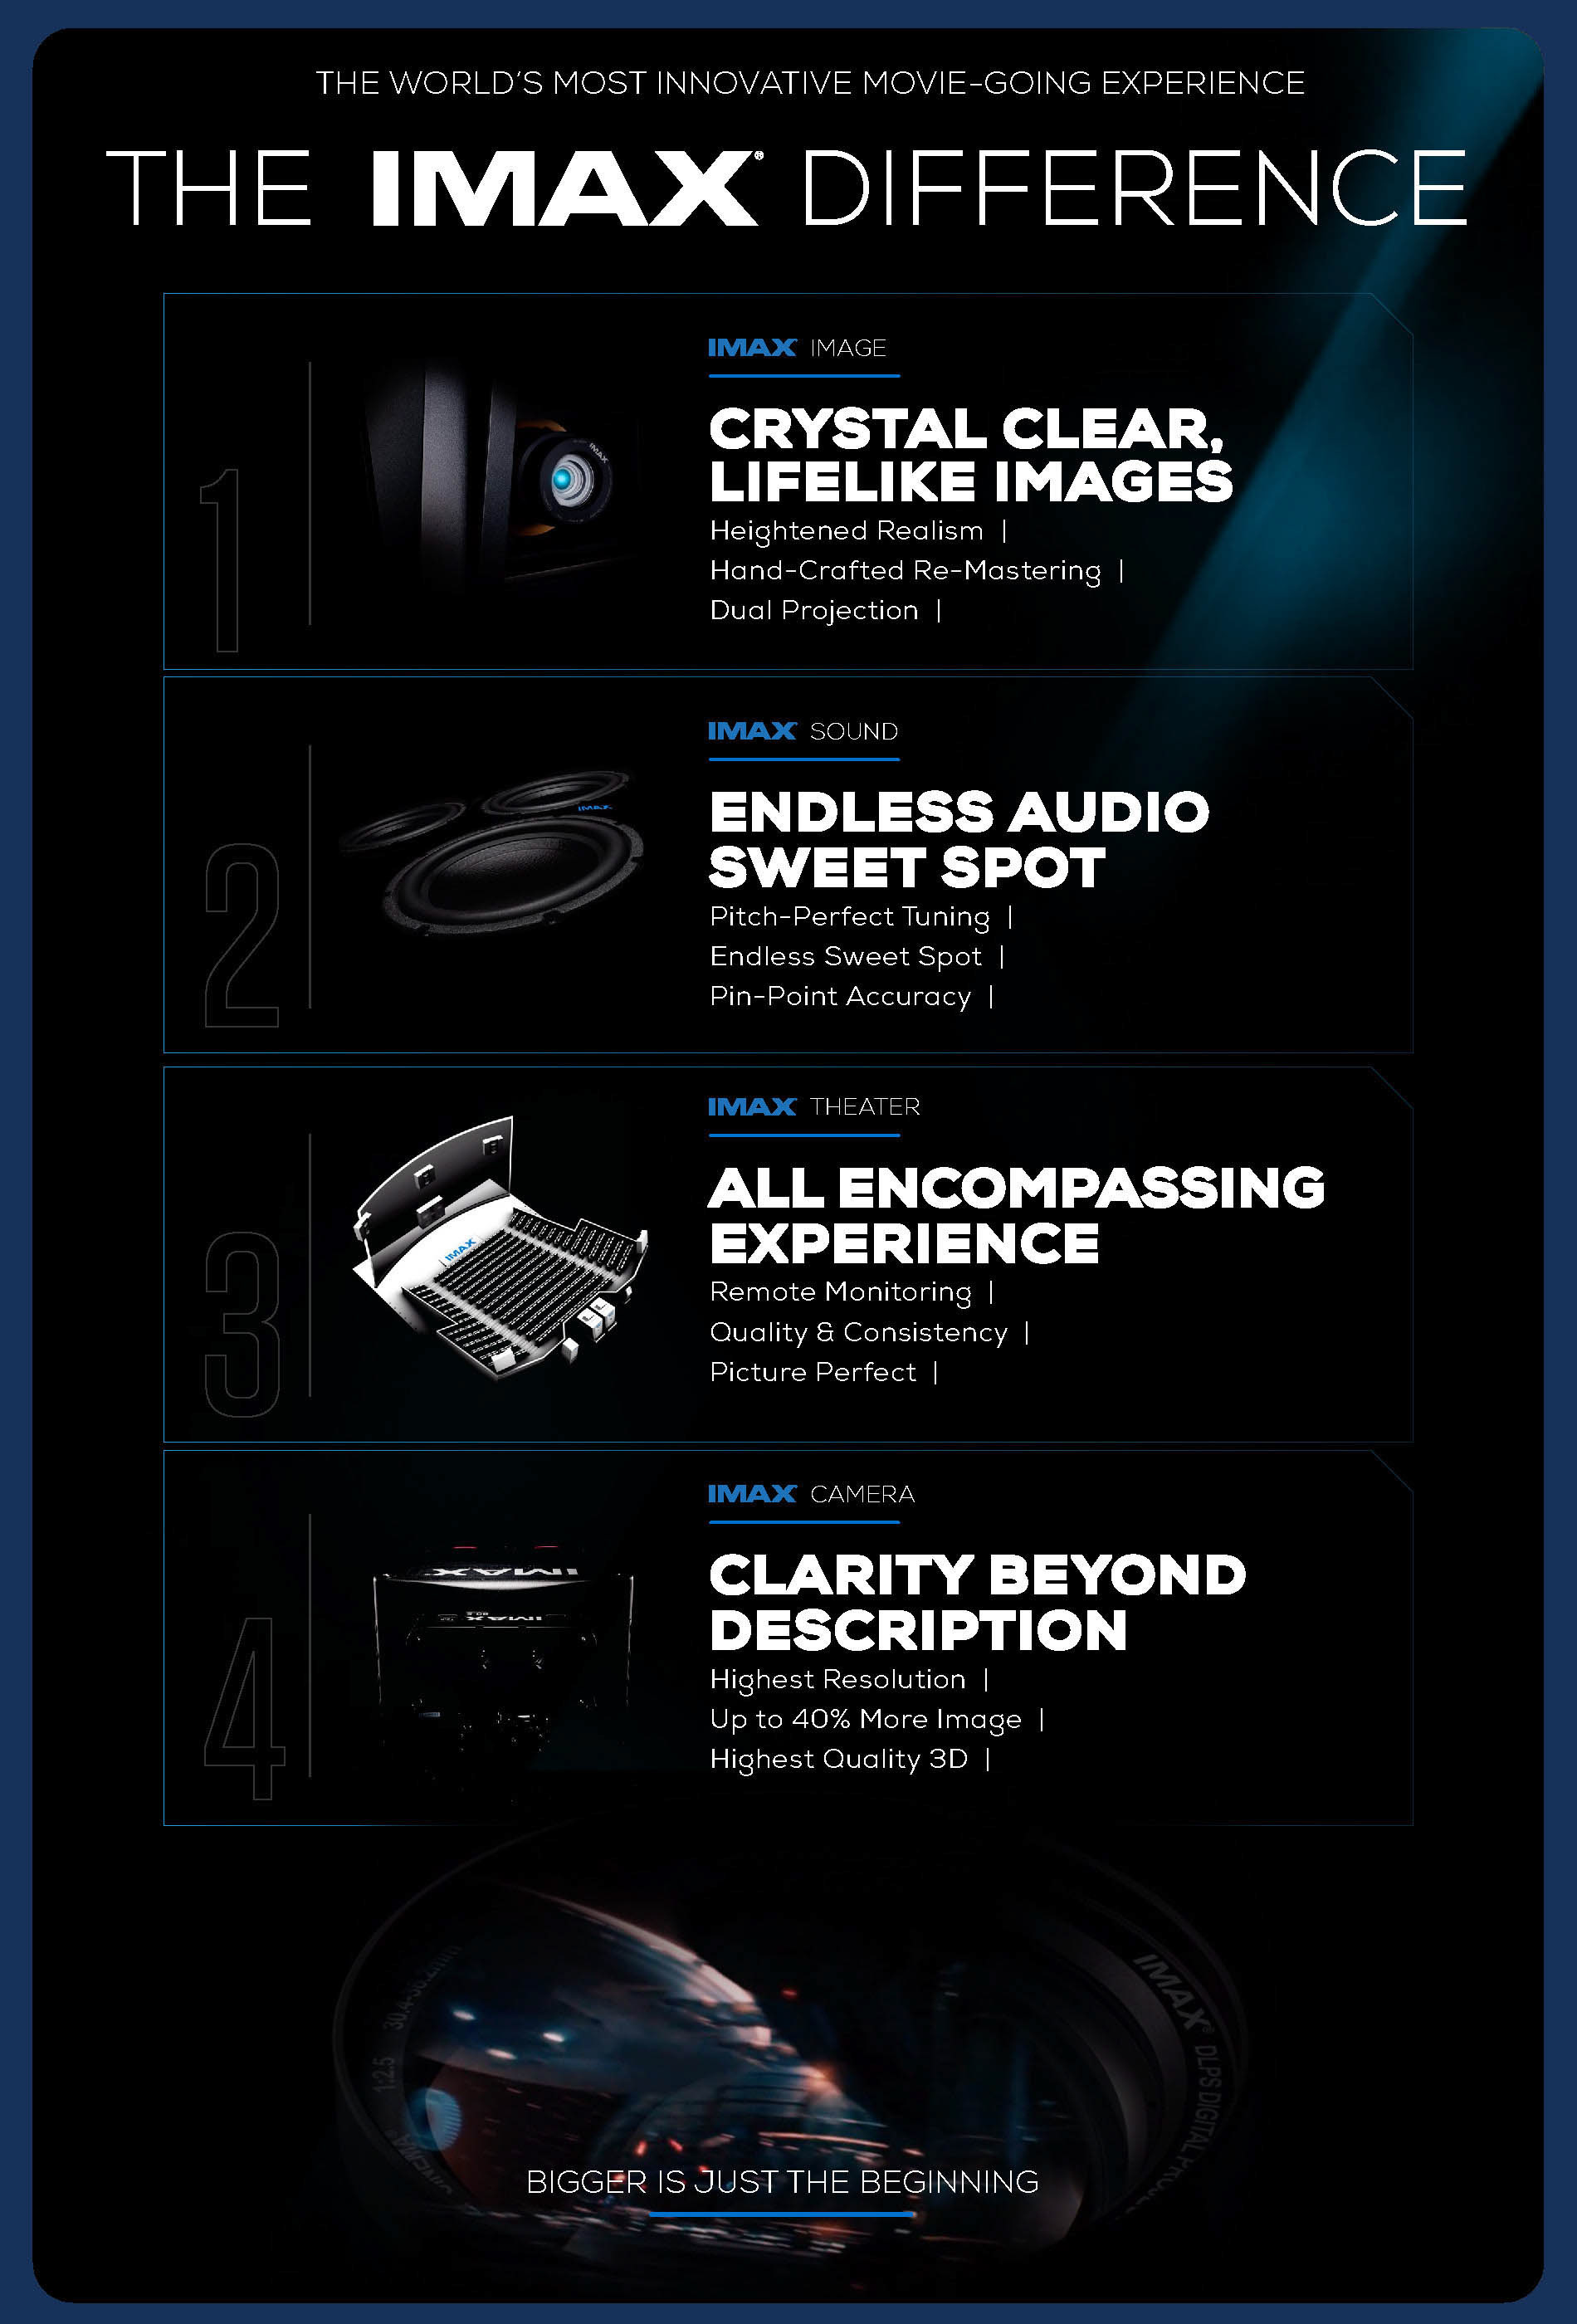
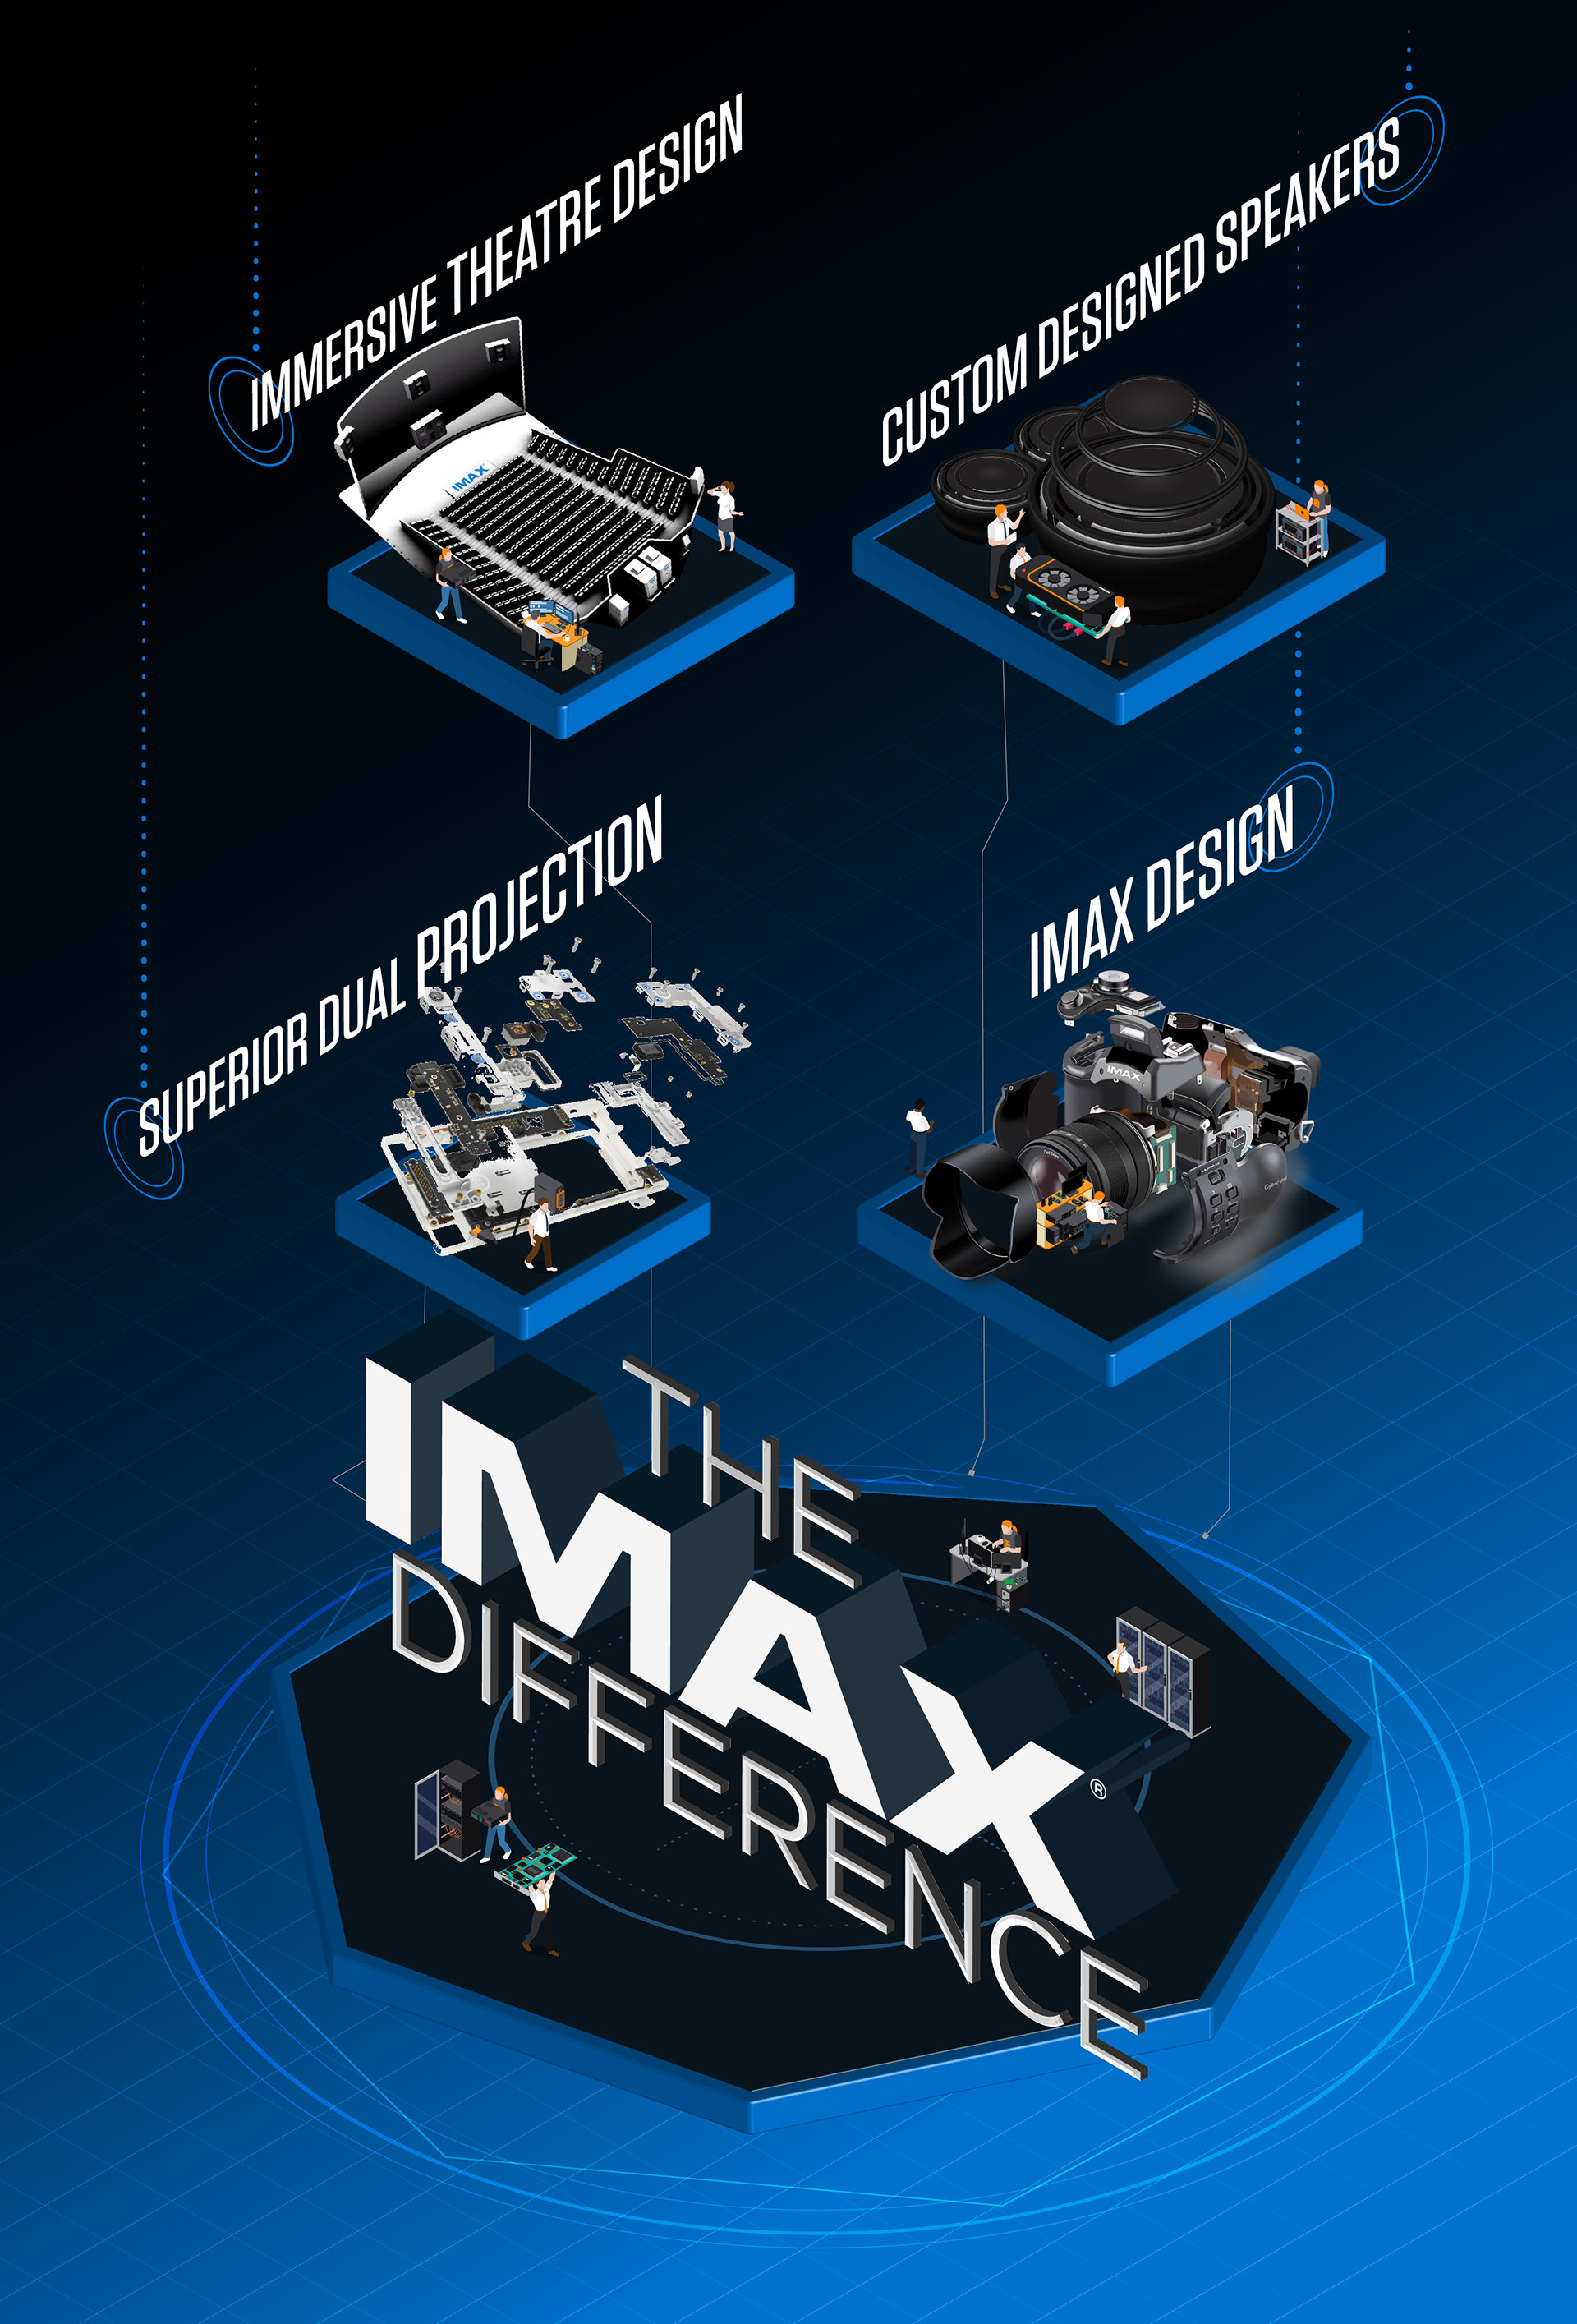
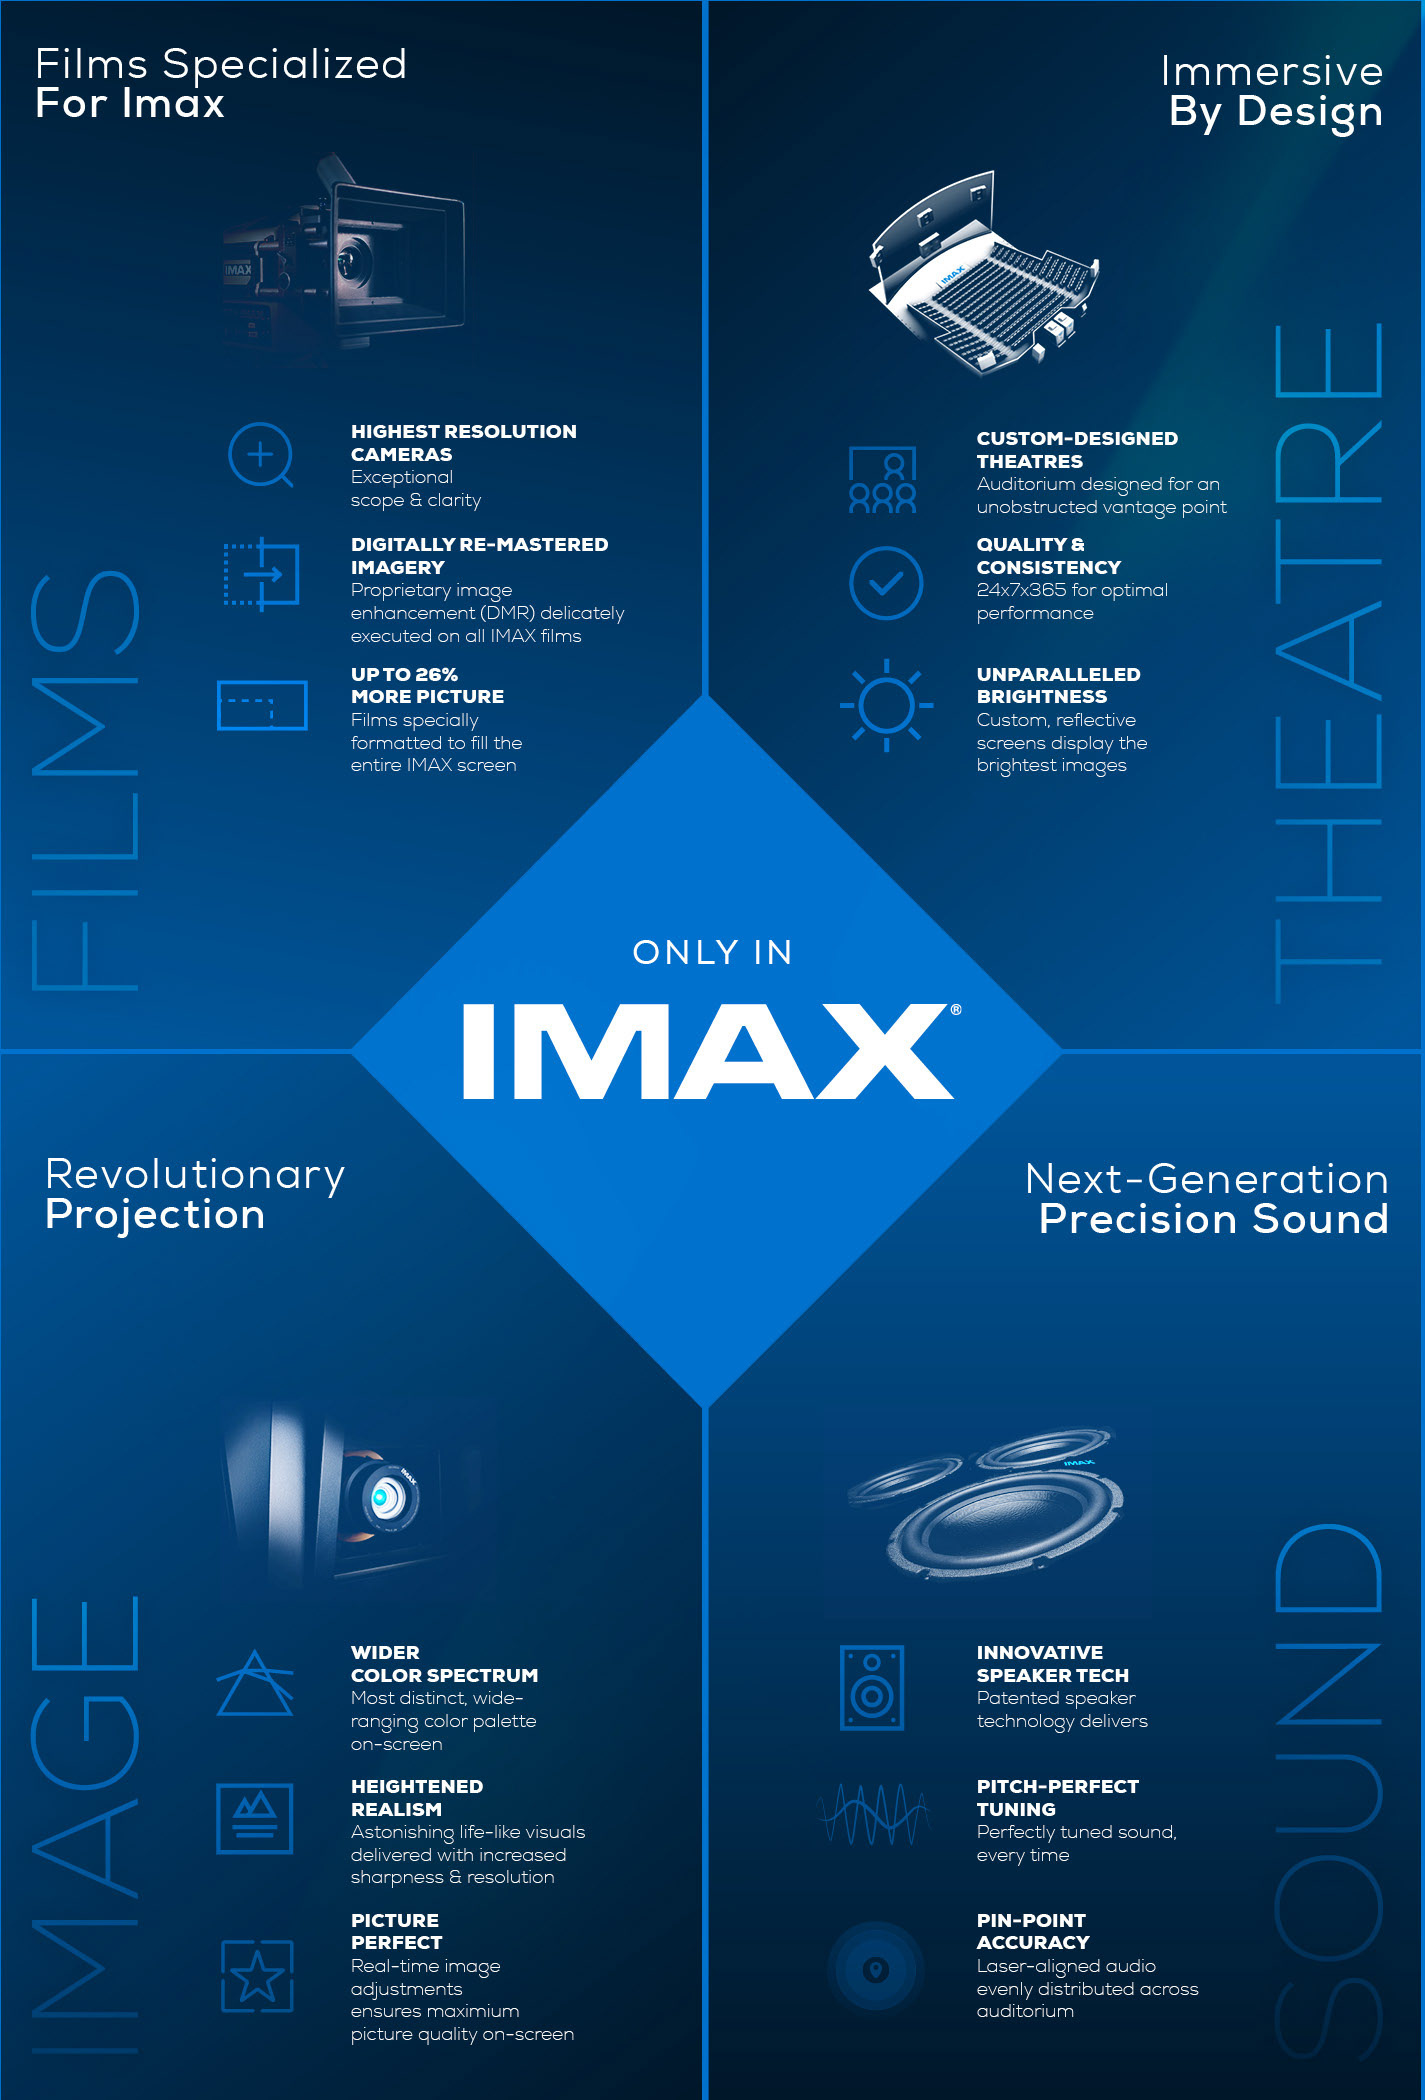
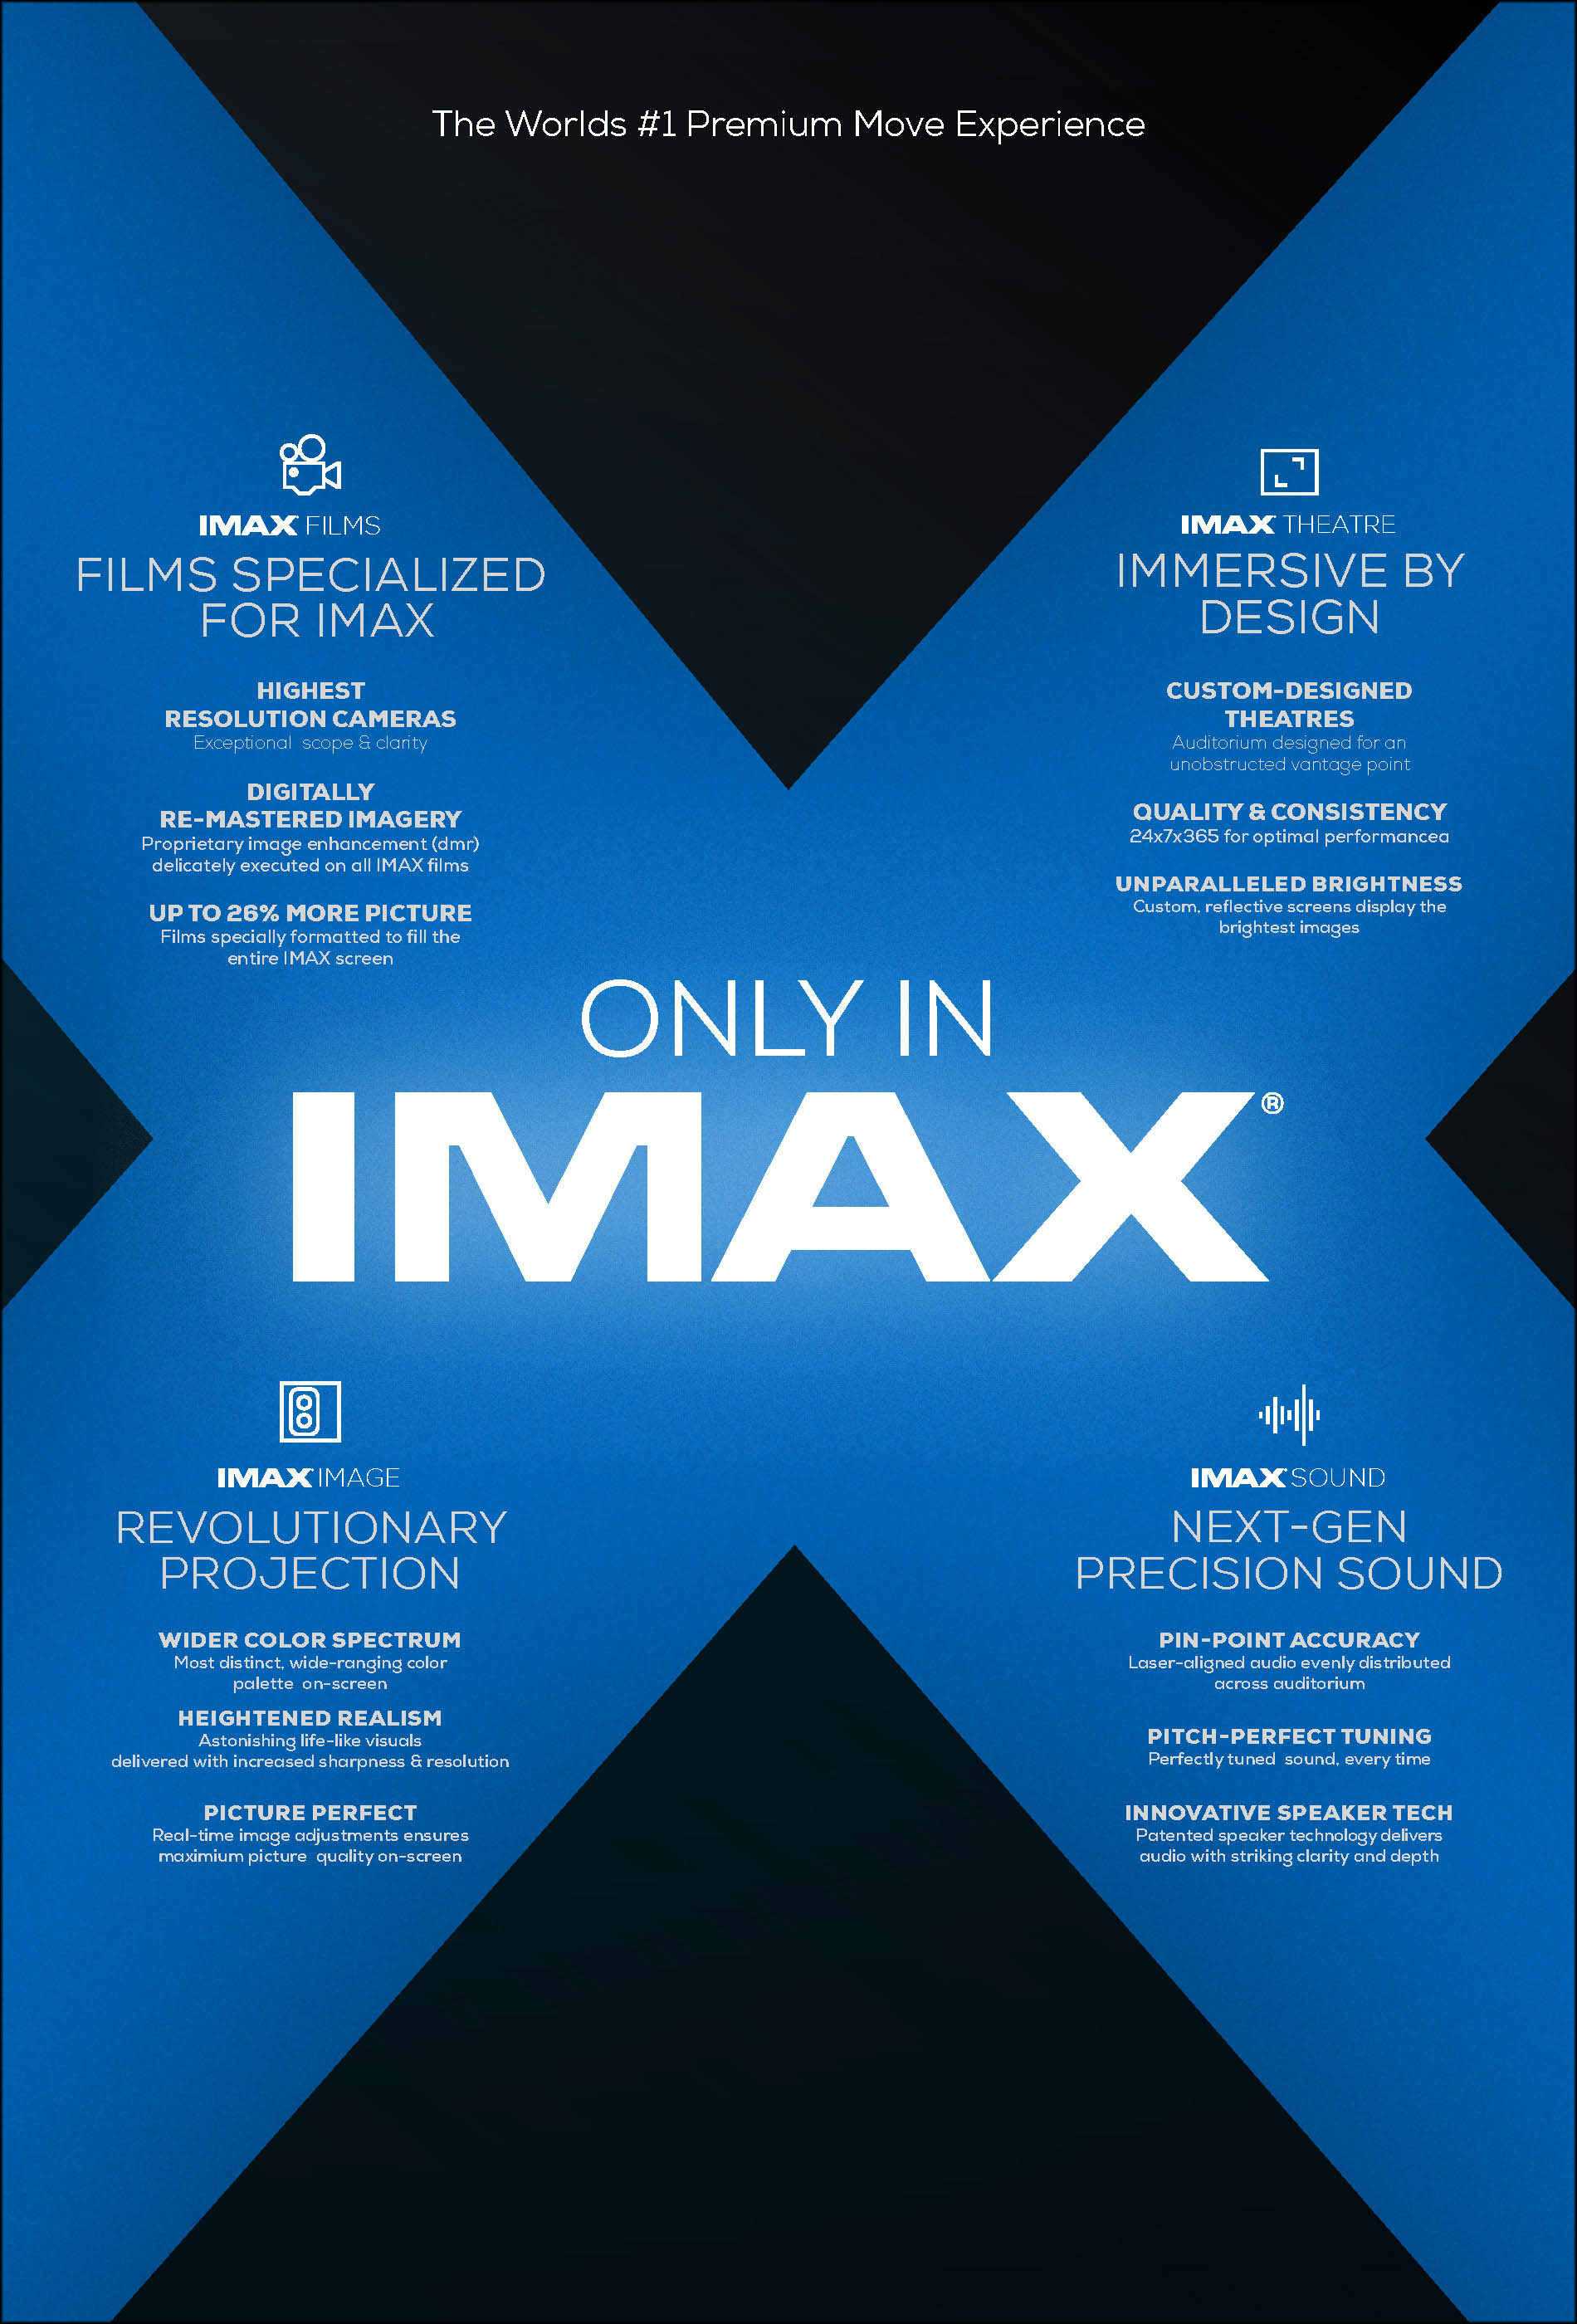
Design a compelling lobby poster for partner theater distributors to communicate the unique advantages of the IMAX experience over competing premium formats. The goal was to translate complex technical specifications such as projection, sound, and theatre geometry into digestible, visually impactful graphics that educate and convert moviegoers in high-traffic areas.
STRATEGY
The approach utilized a premium, dark aesthetic accented by IMAX’s signature electric blue to evoke cinematic immersion. Complex technical differentiators were distilled into sleek, futuristic infographics and diagrams. The visual hierarchy heavily emphasized “The IMAX Difference,” positioning the format not just as a bigger screen, but as the superior, unmissable cinematic choice.

CLIENT

DATA VISUALIZATION
MOTION GRAPHICS ANIMATION
Project DATE | 2022
BRIEF
Create a dynamic motion graphic for a DDB presentation to visualize the agency’s evolving relationship with clients. The objective was to replace static diagrams with an animation demonstrating how diverse capabilities, from PR to commerce, fluidly orbit and interact with the client, illustrating a flexible, integrated, and client-centric service model.
STRATEGY
I utilized a rotating 3D network metaphor, placing the “Client” at the core of a web of agency disciplines. By animating the perspective, the graphic emphasizes connectivity and the agency’s agility to pivot focus. The sleek, data-inspired aesthetic visually communicates a modern, interconnected ecosystem that adapts to changing business needs.
CLIENT

www.mars.com

BUSINESS TO BUSINESS
PRESENTATION DECK DESIGN
PRESENTATION DECK DESIGN
CONCEPT, LAYOUT, TYPOGRAPHY, AND DATA VISUALIZATION
Project DATE | 2022
BRIEF
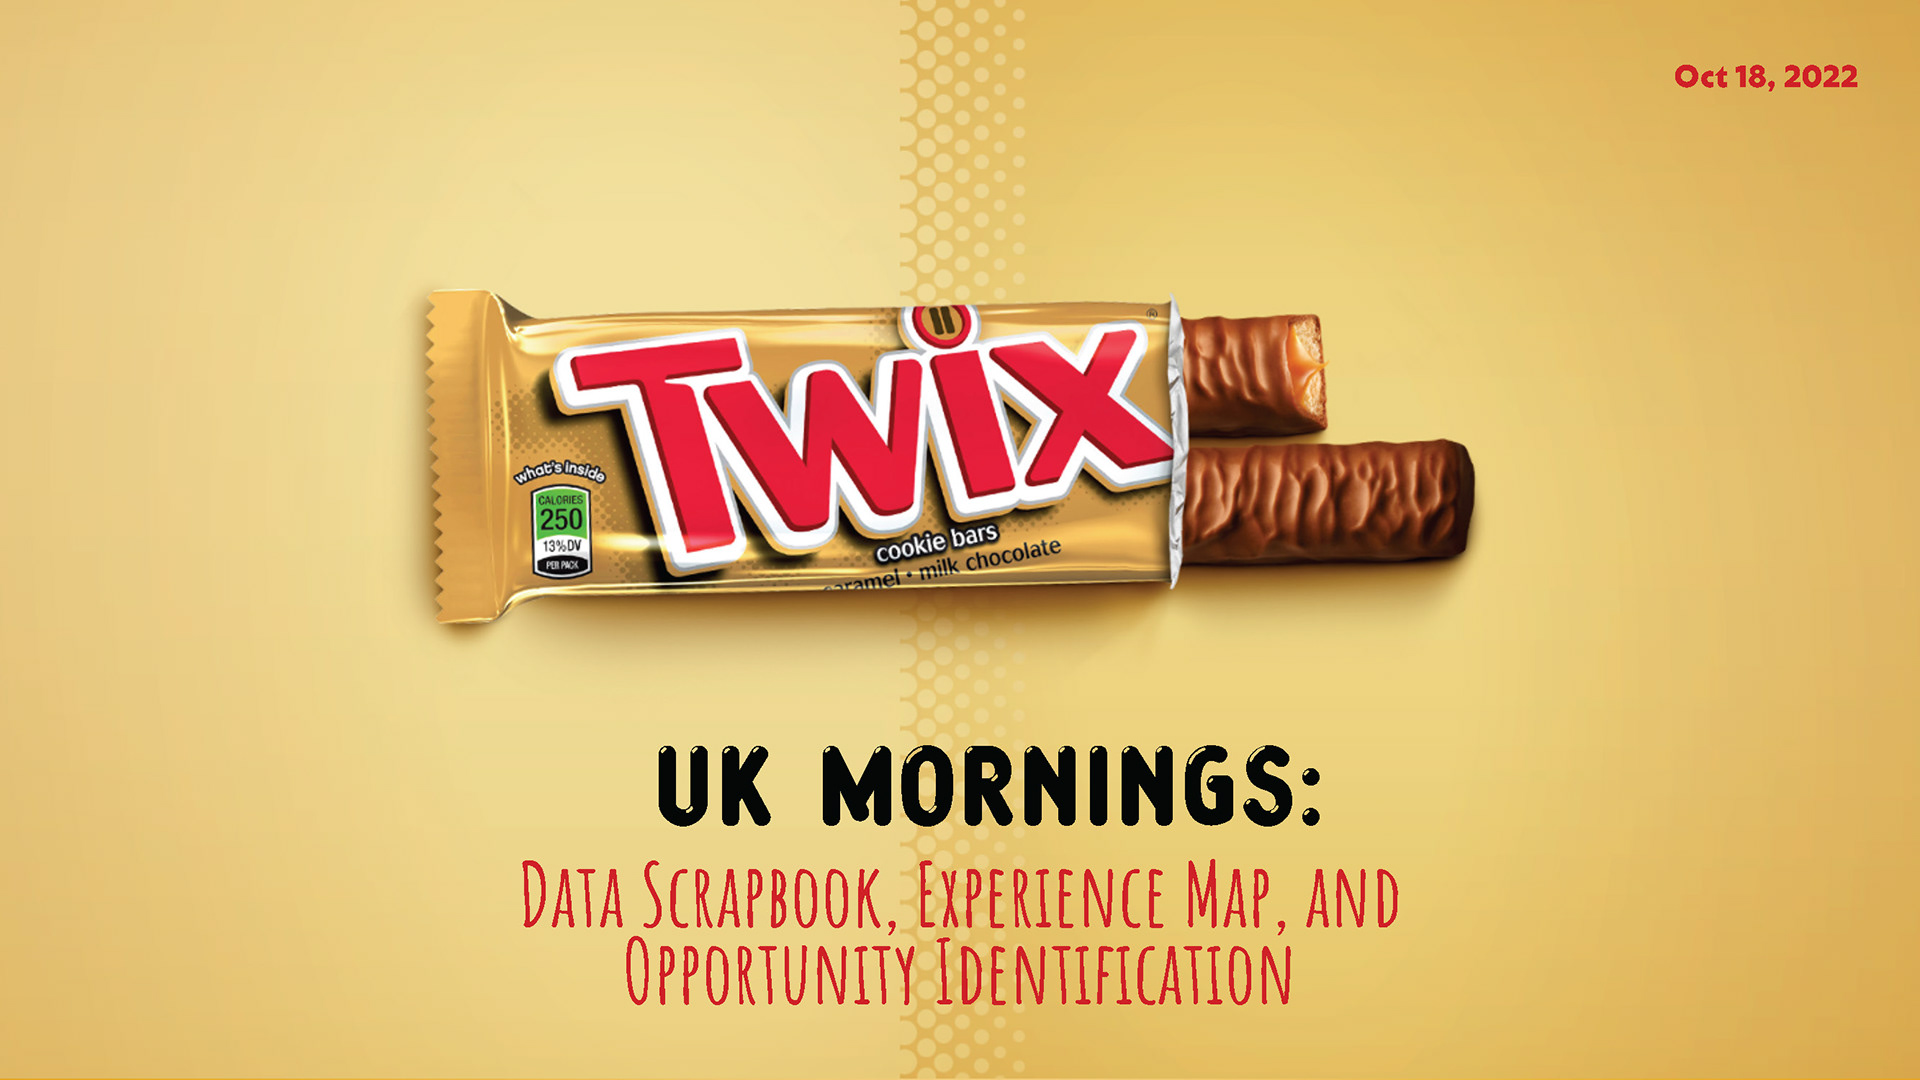
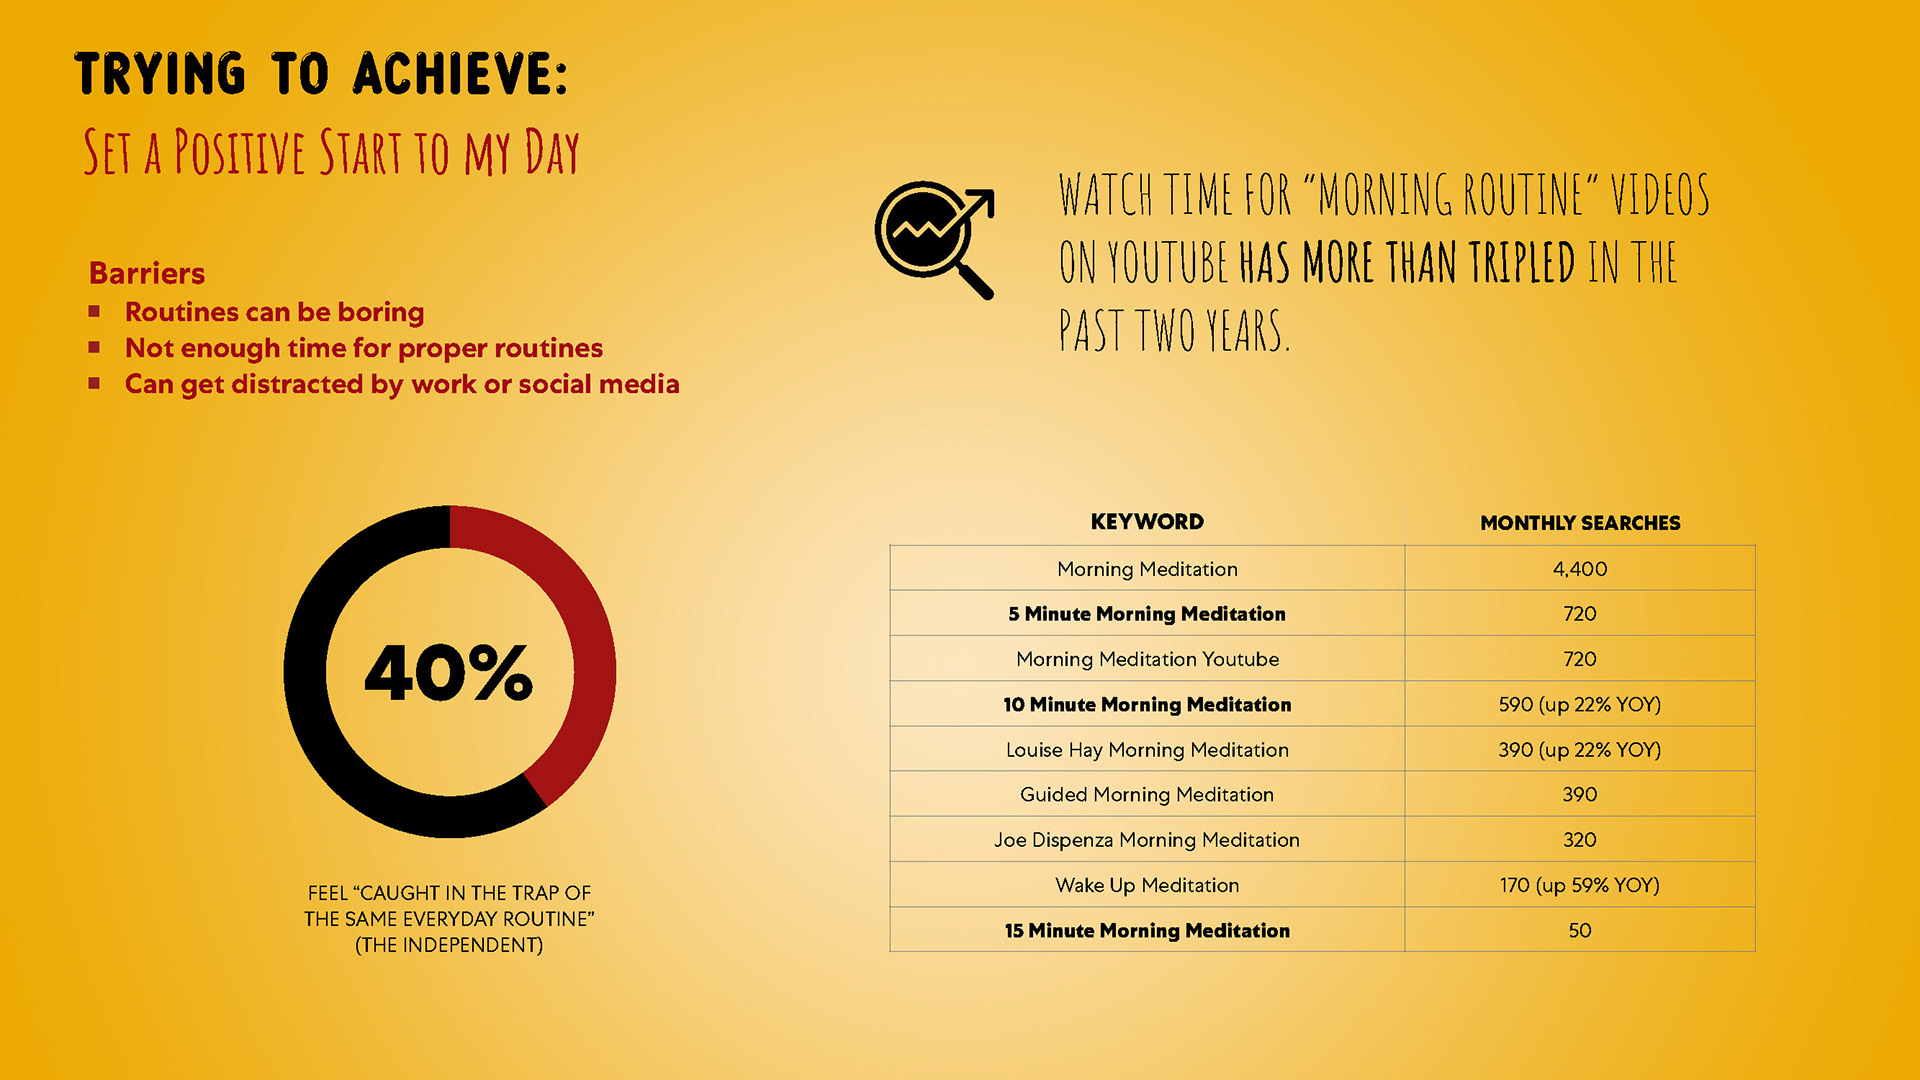
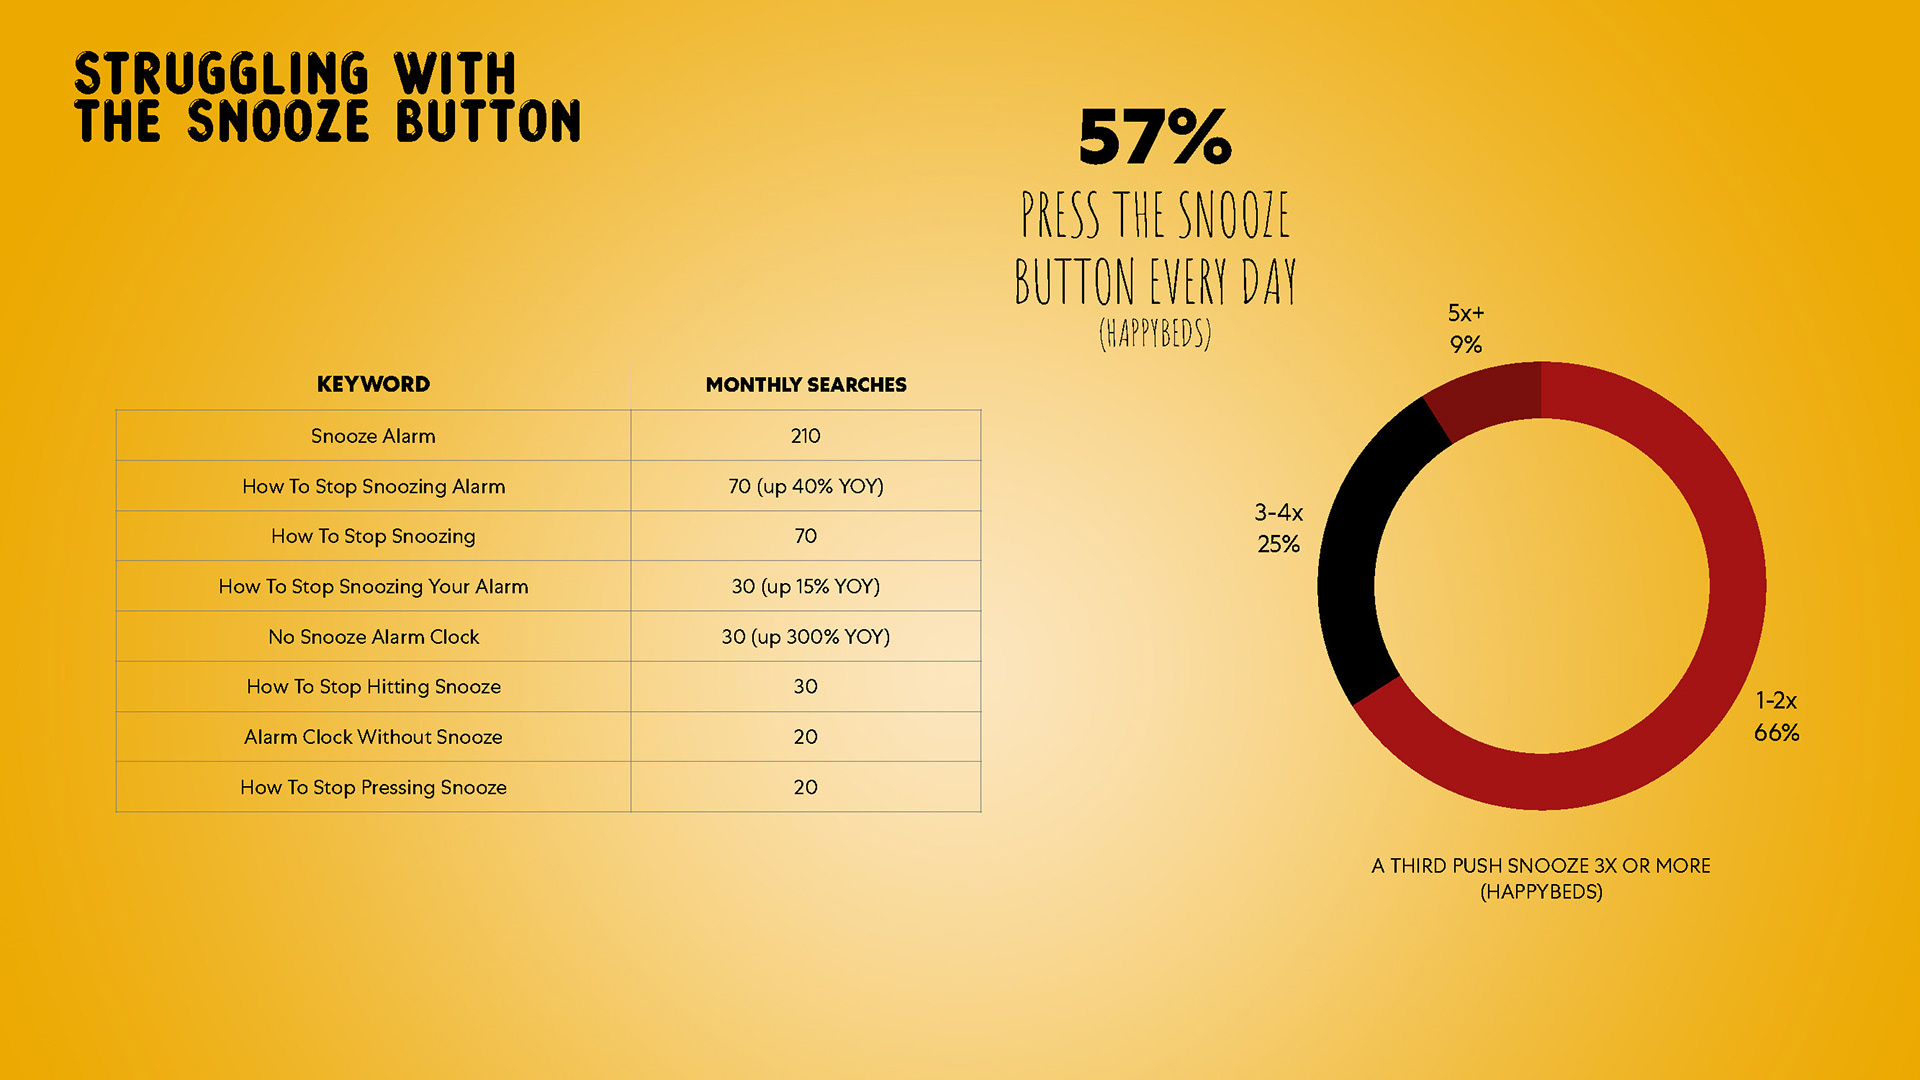
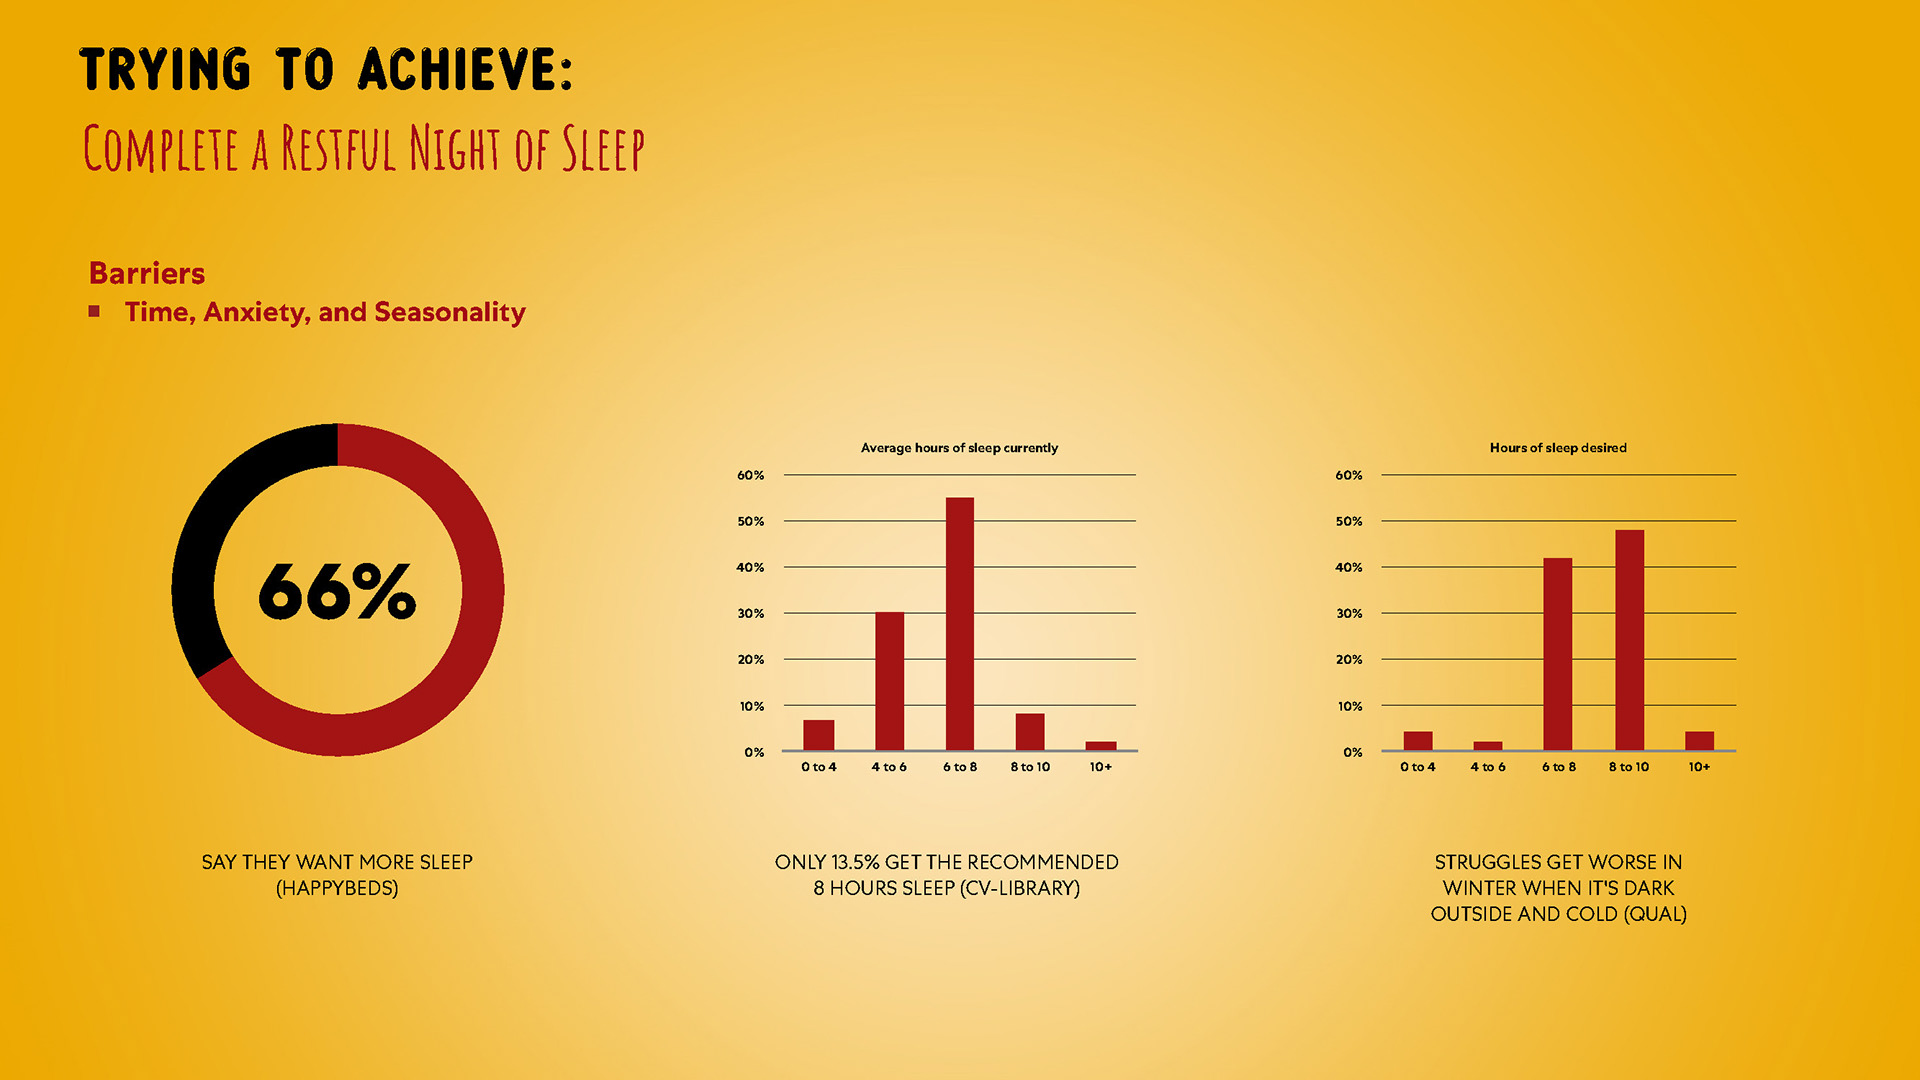
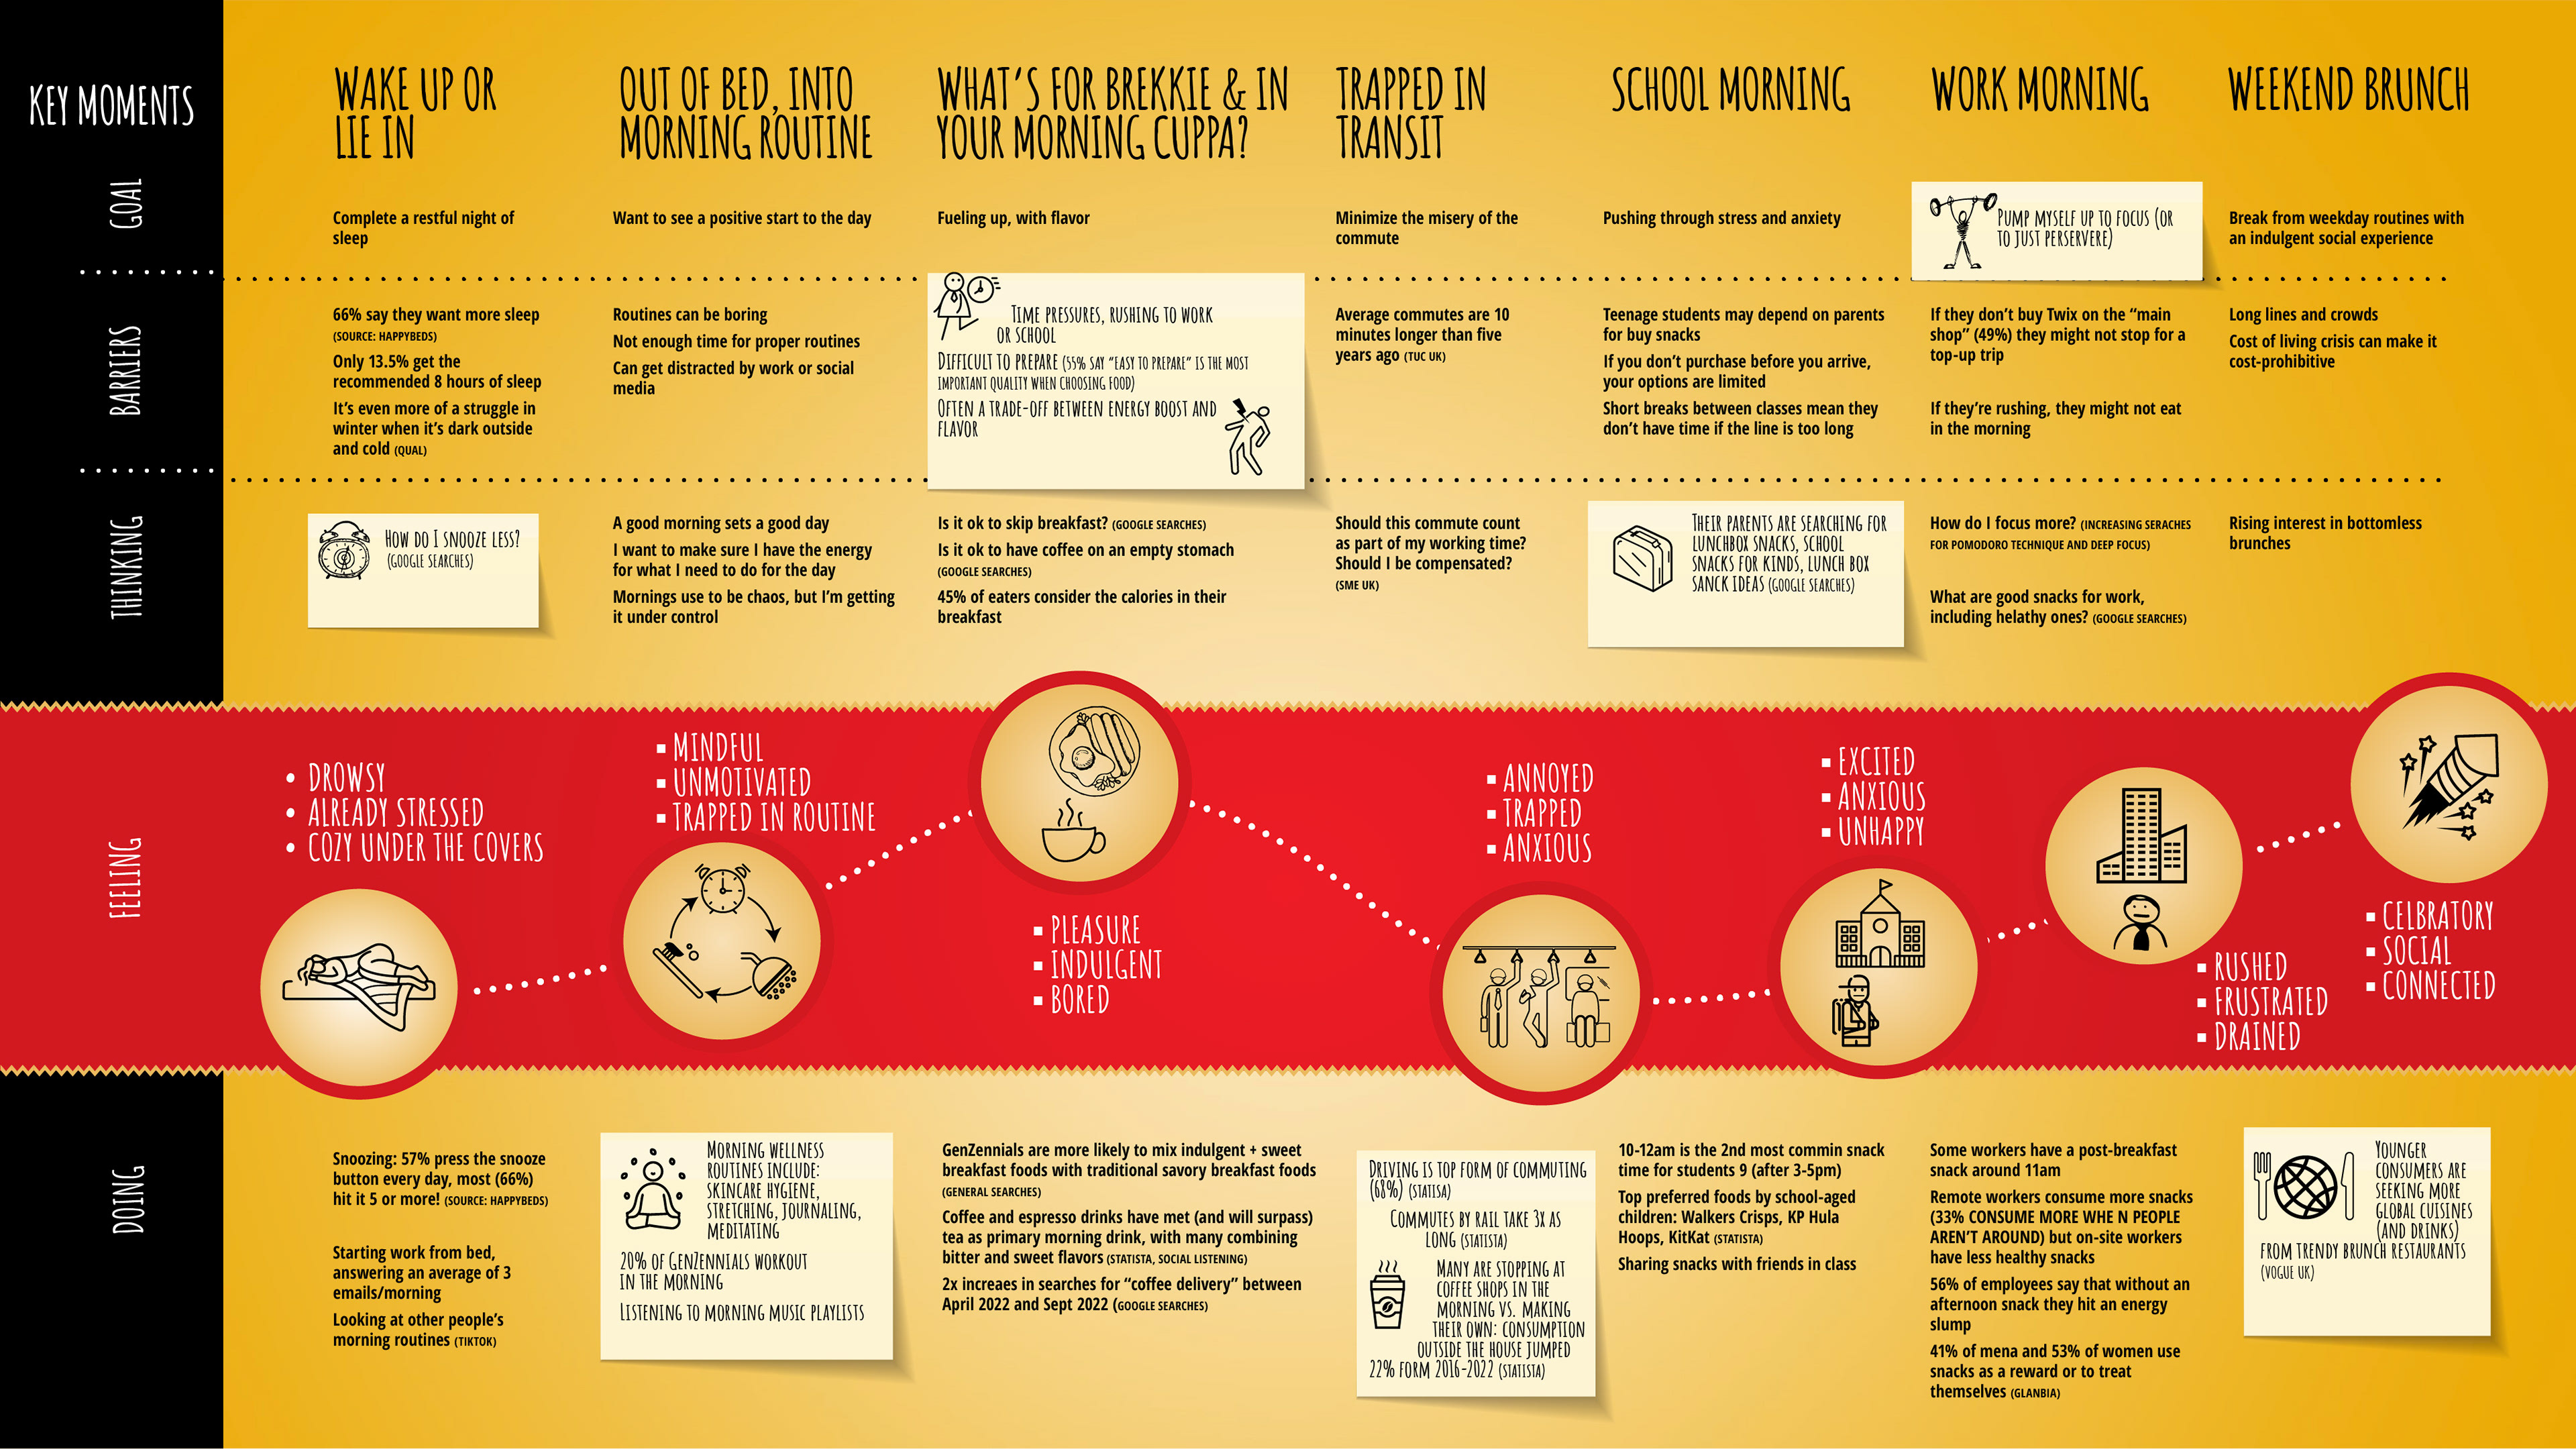
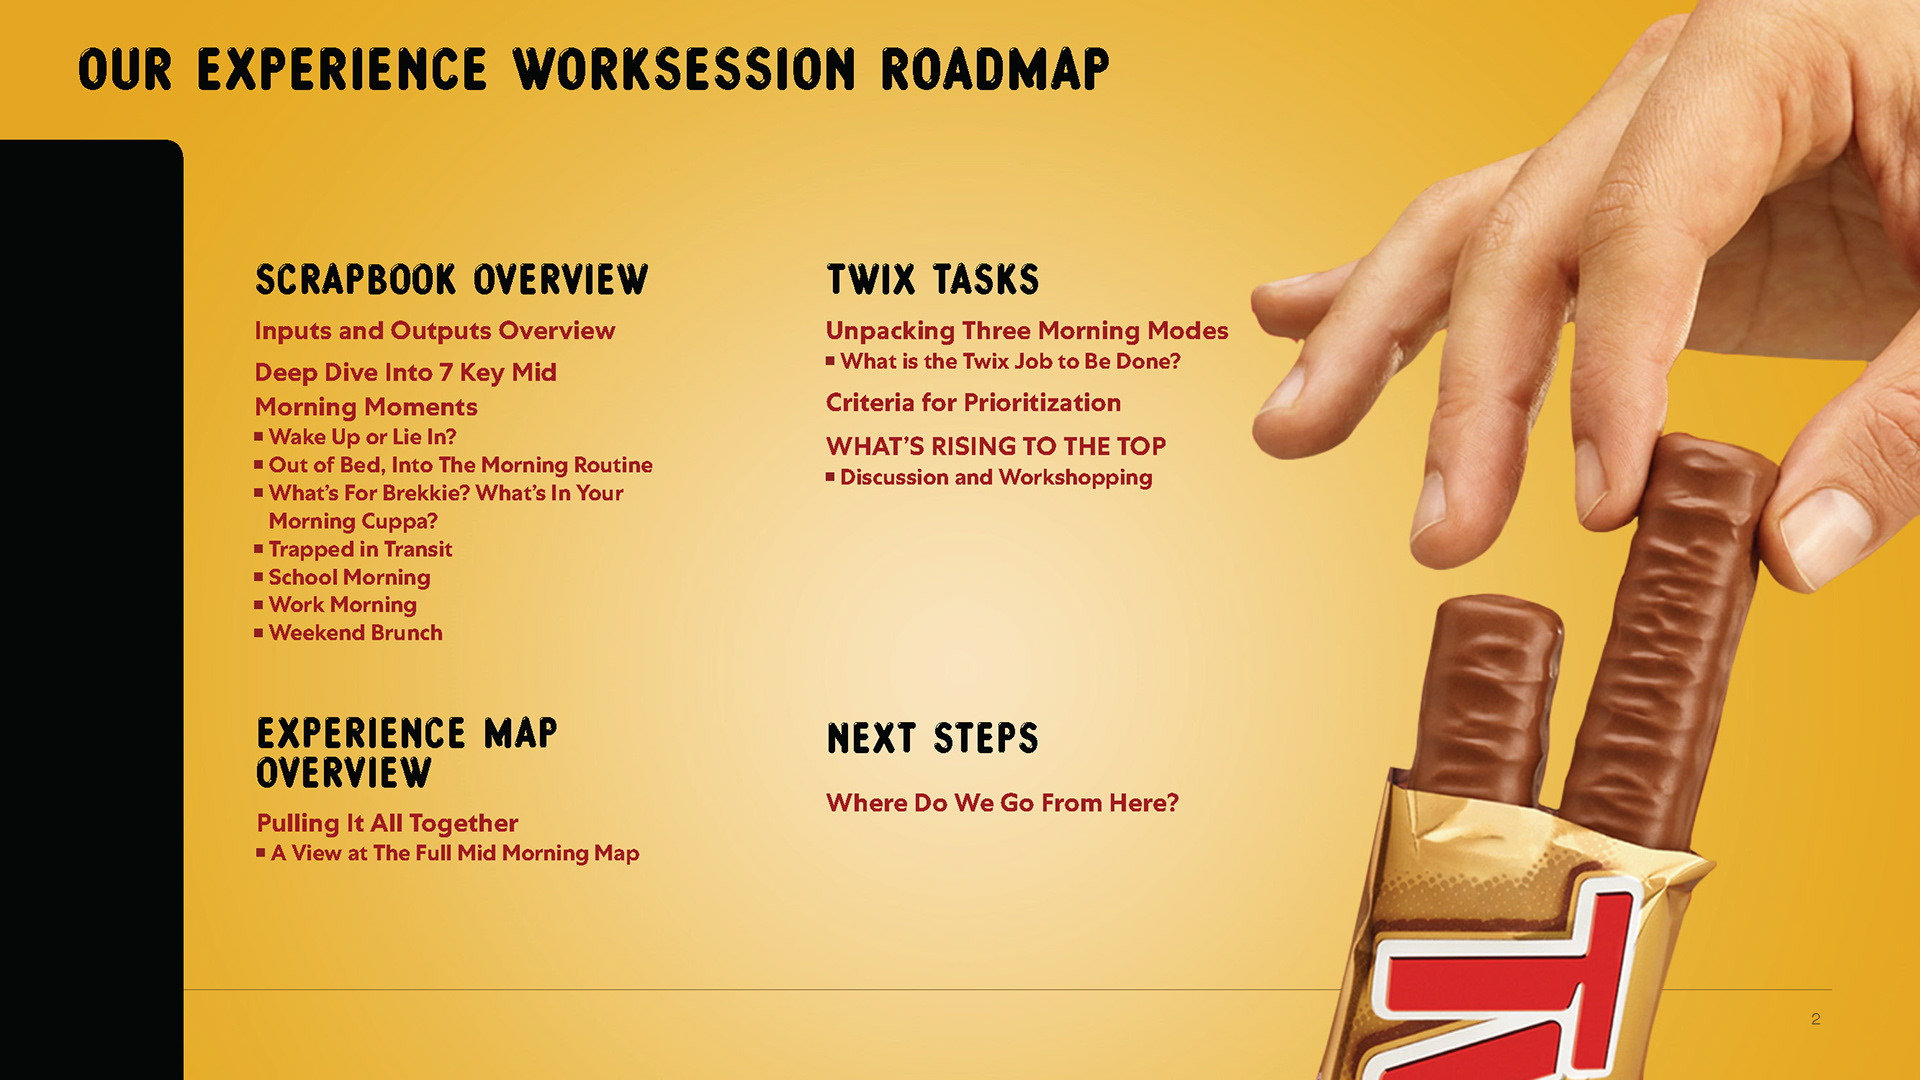
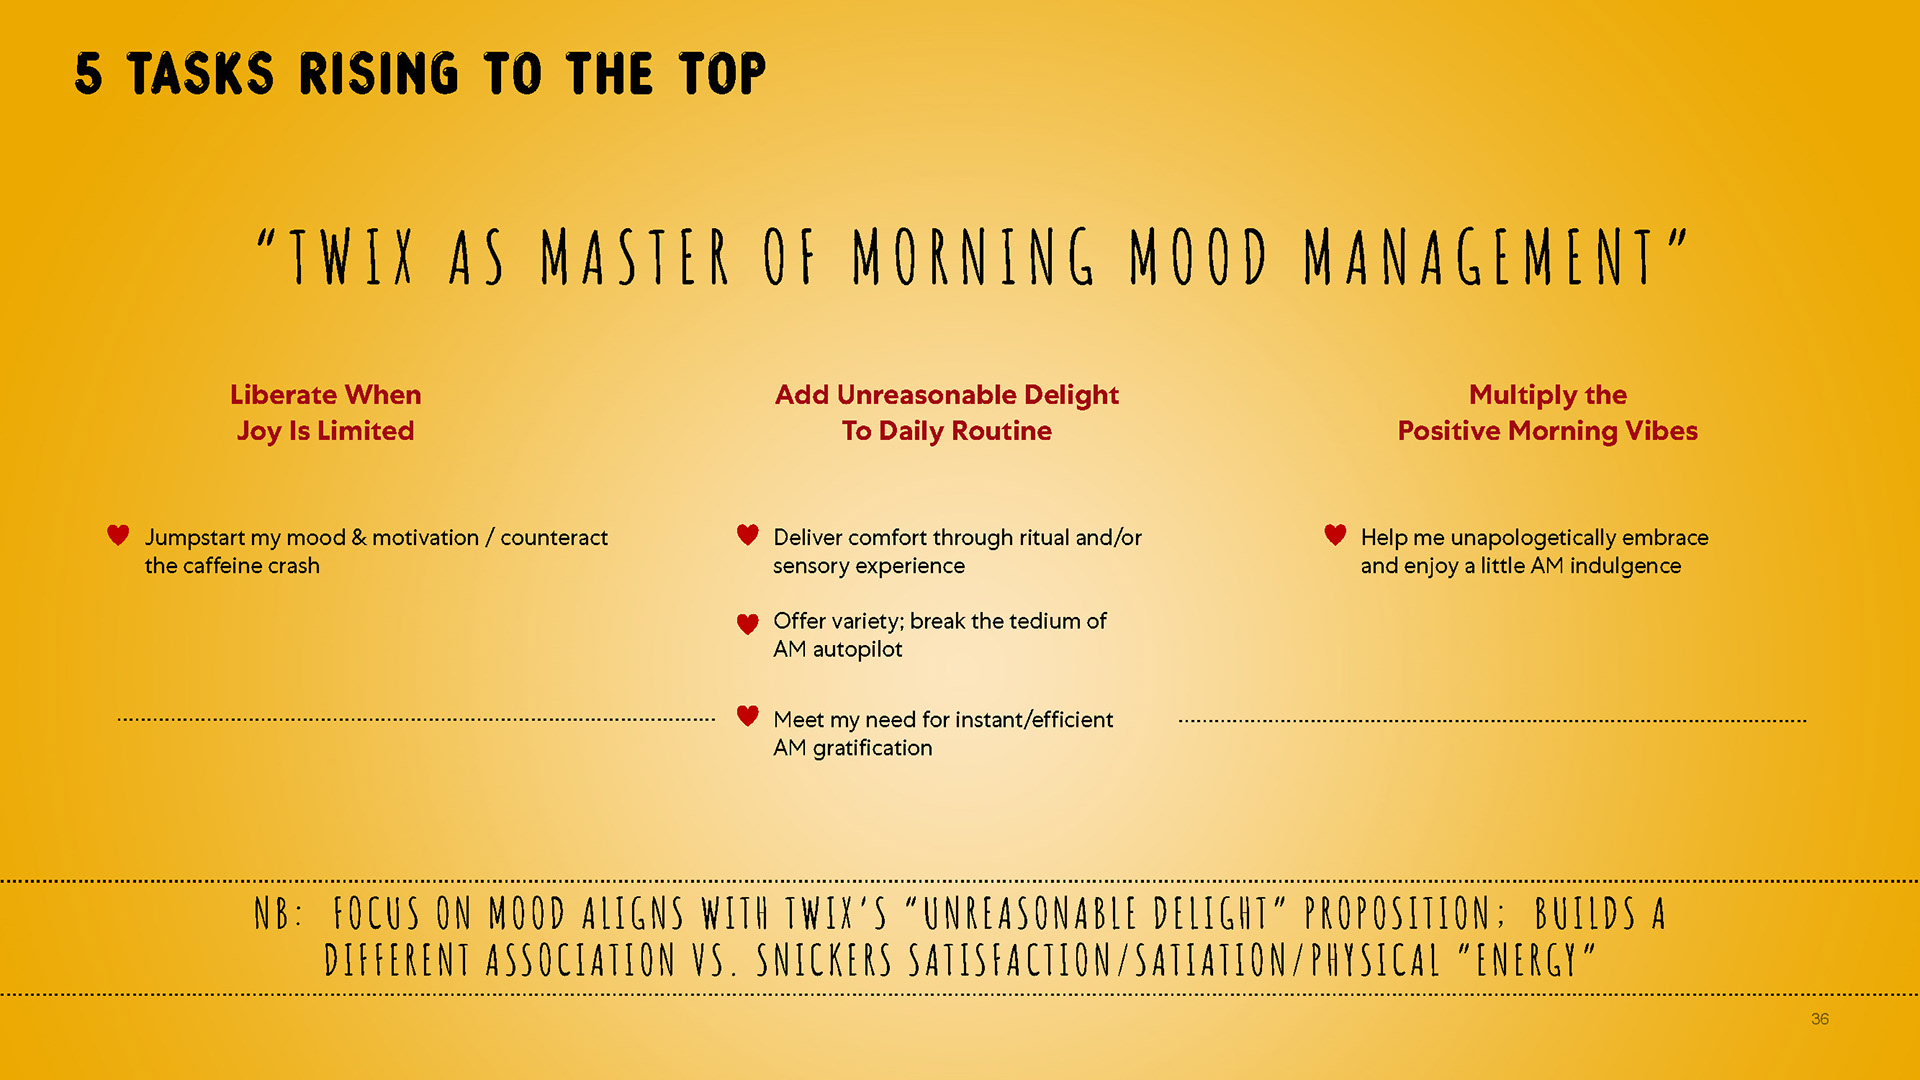
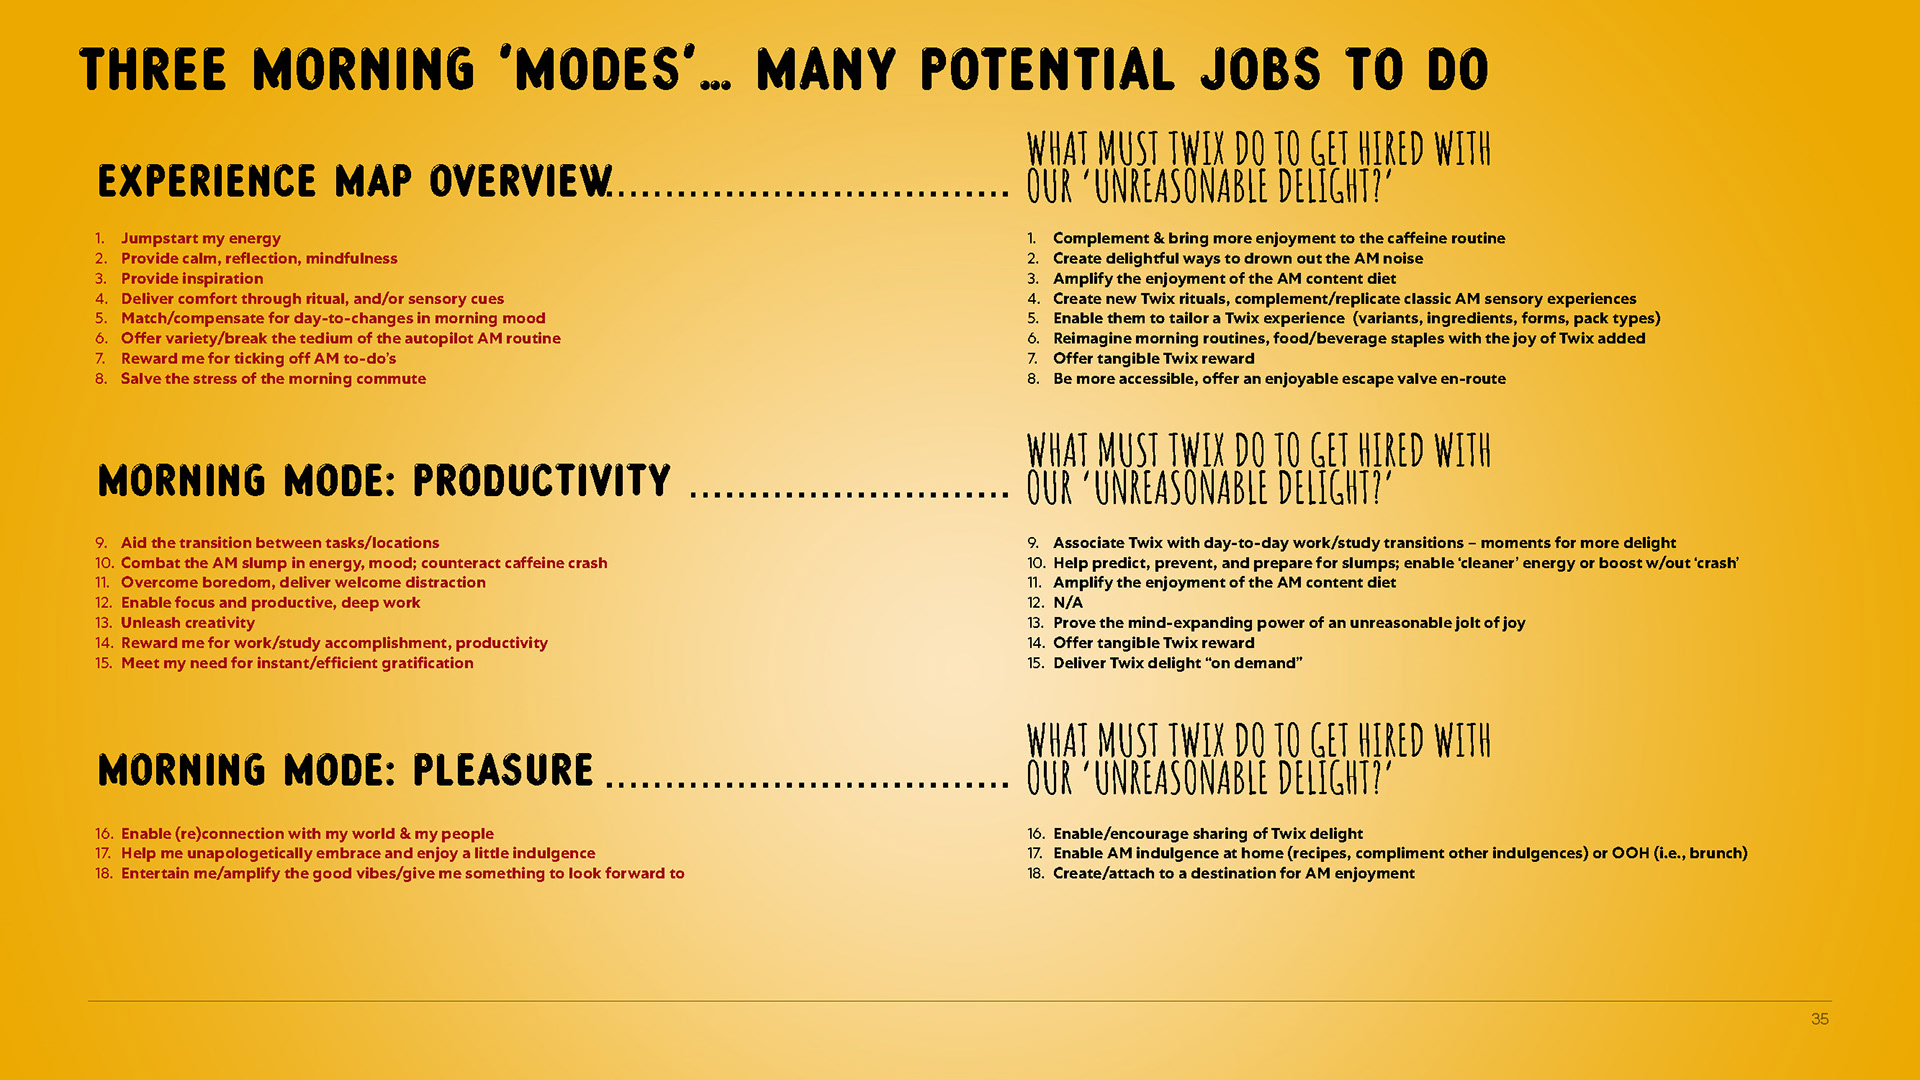
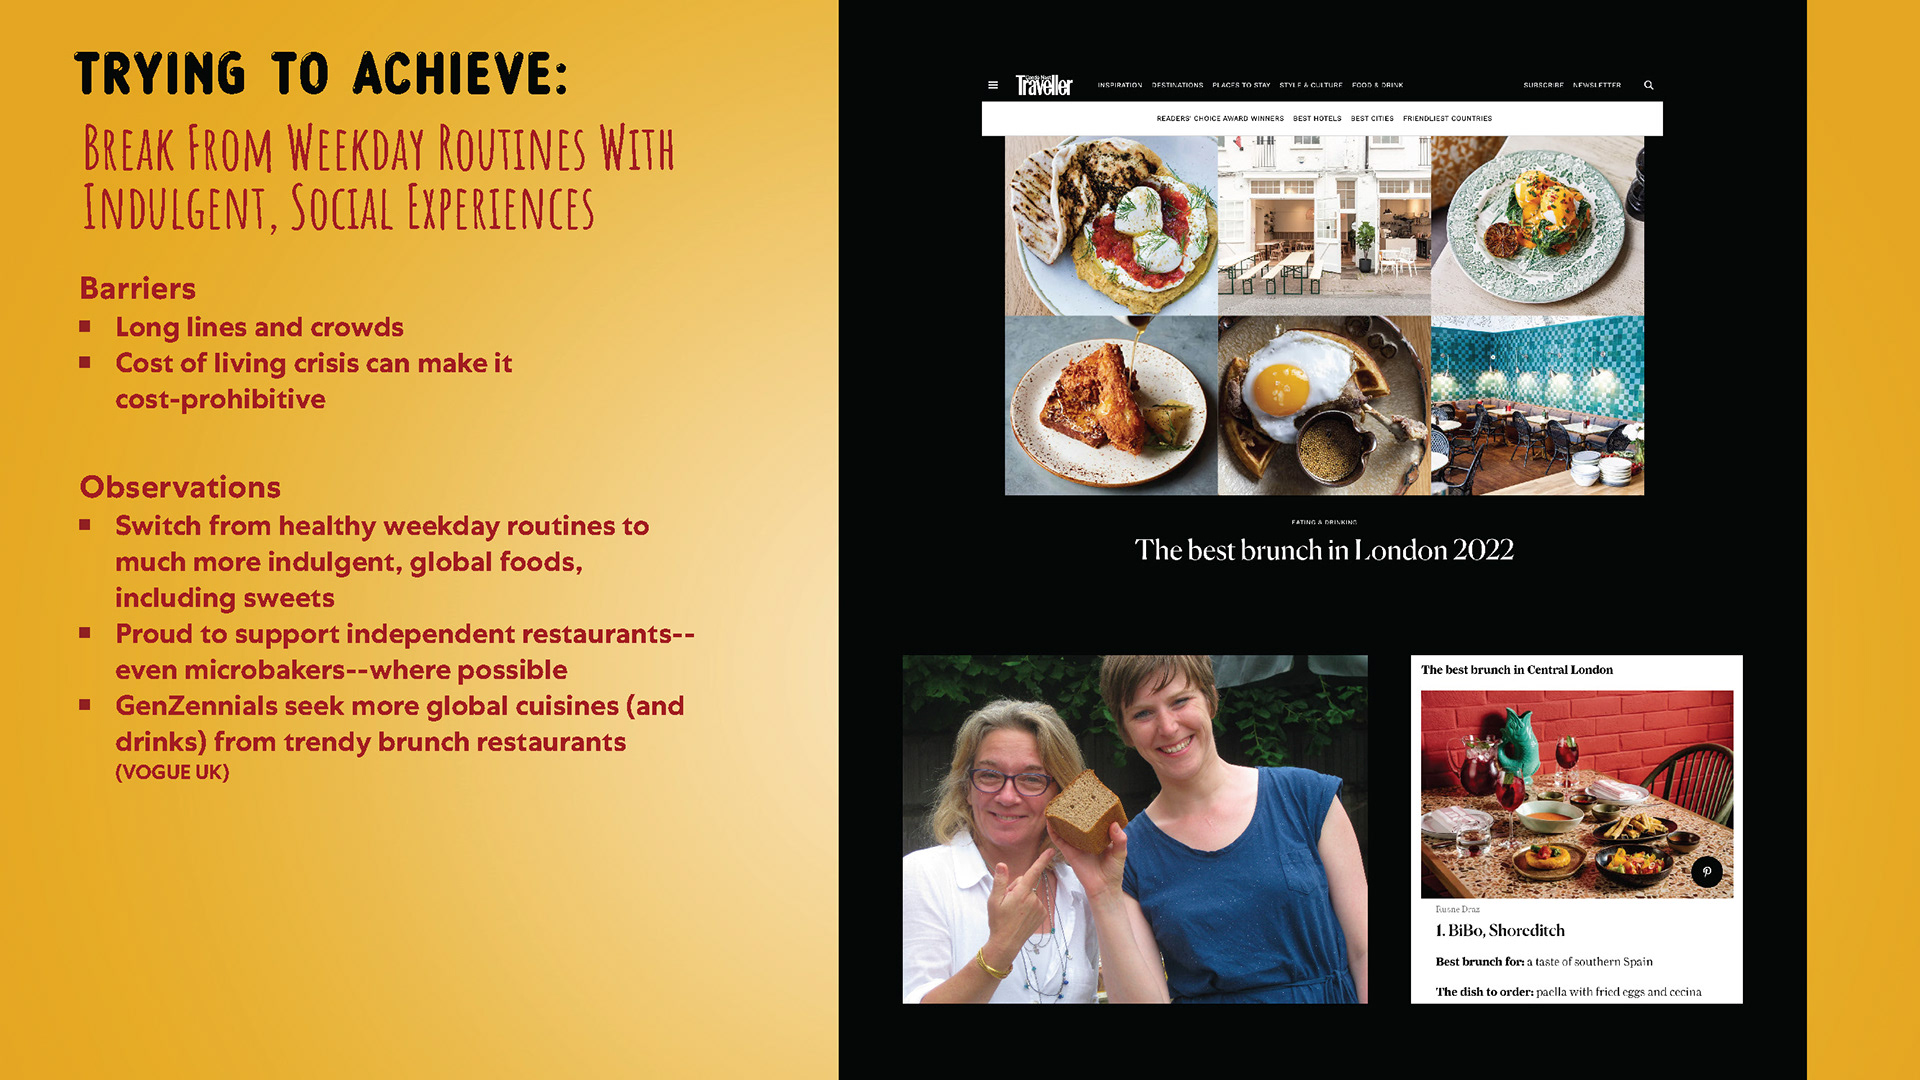
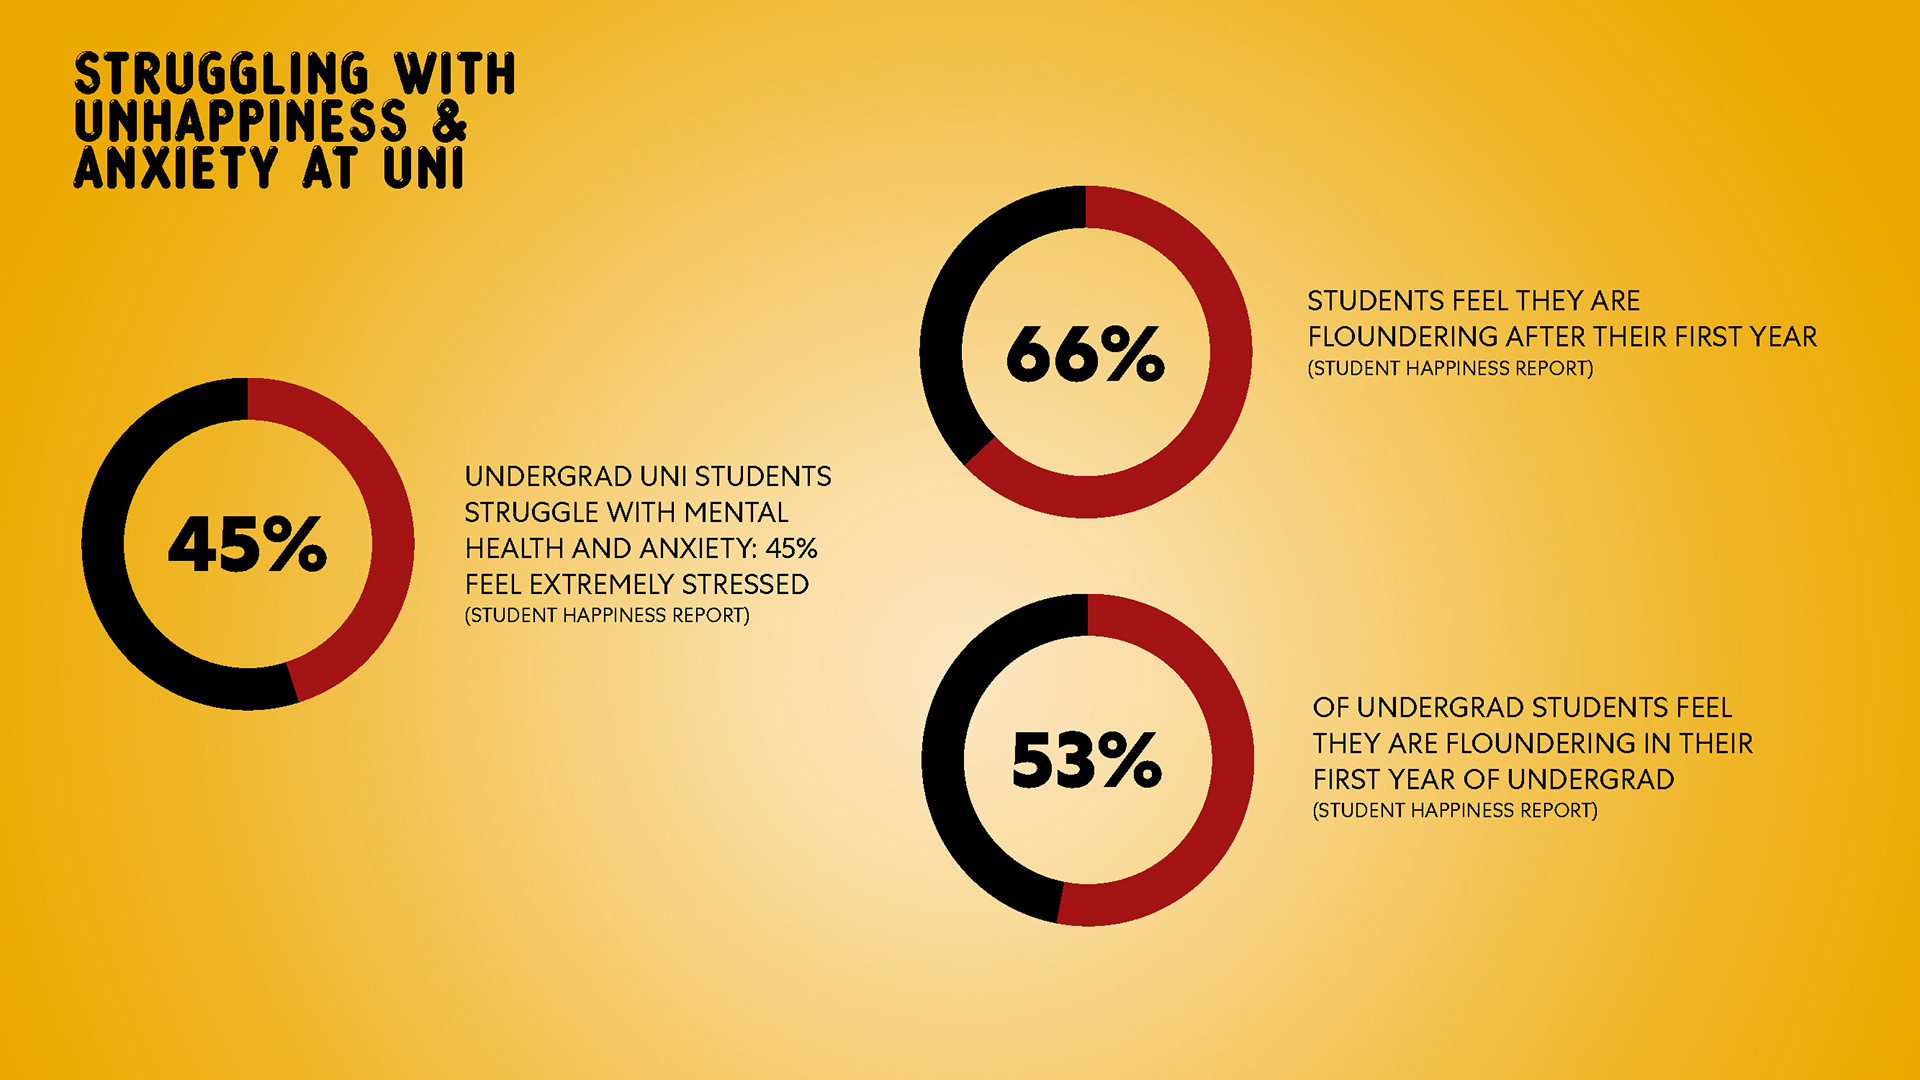
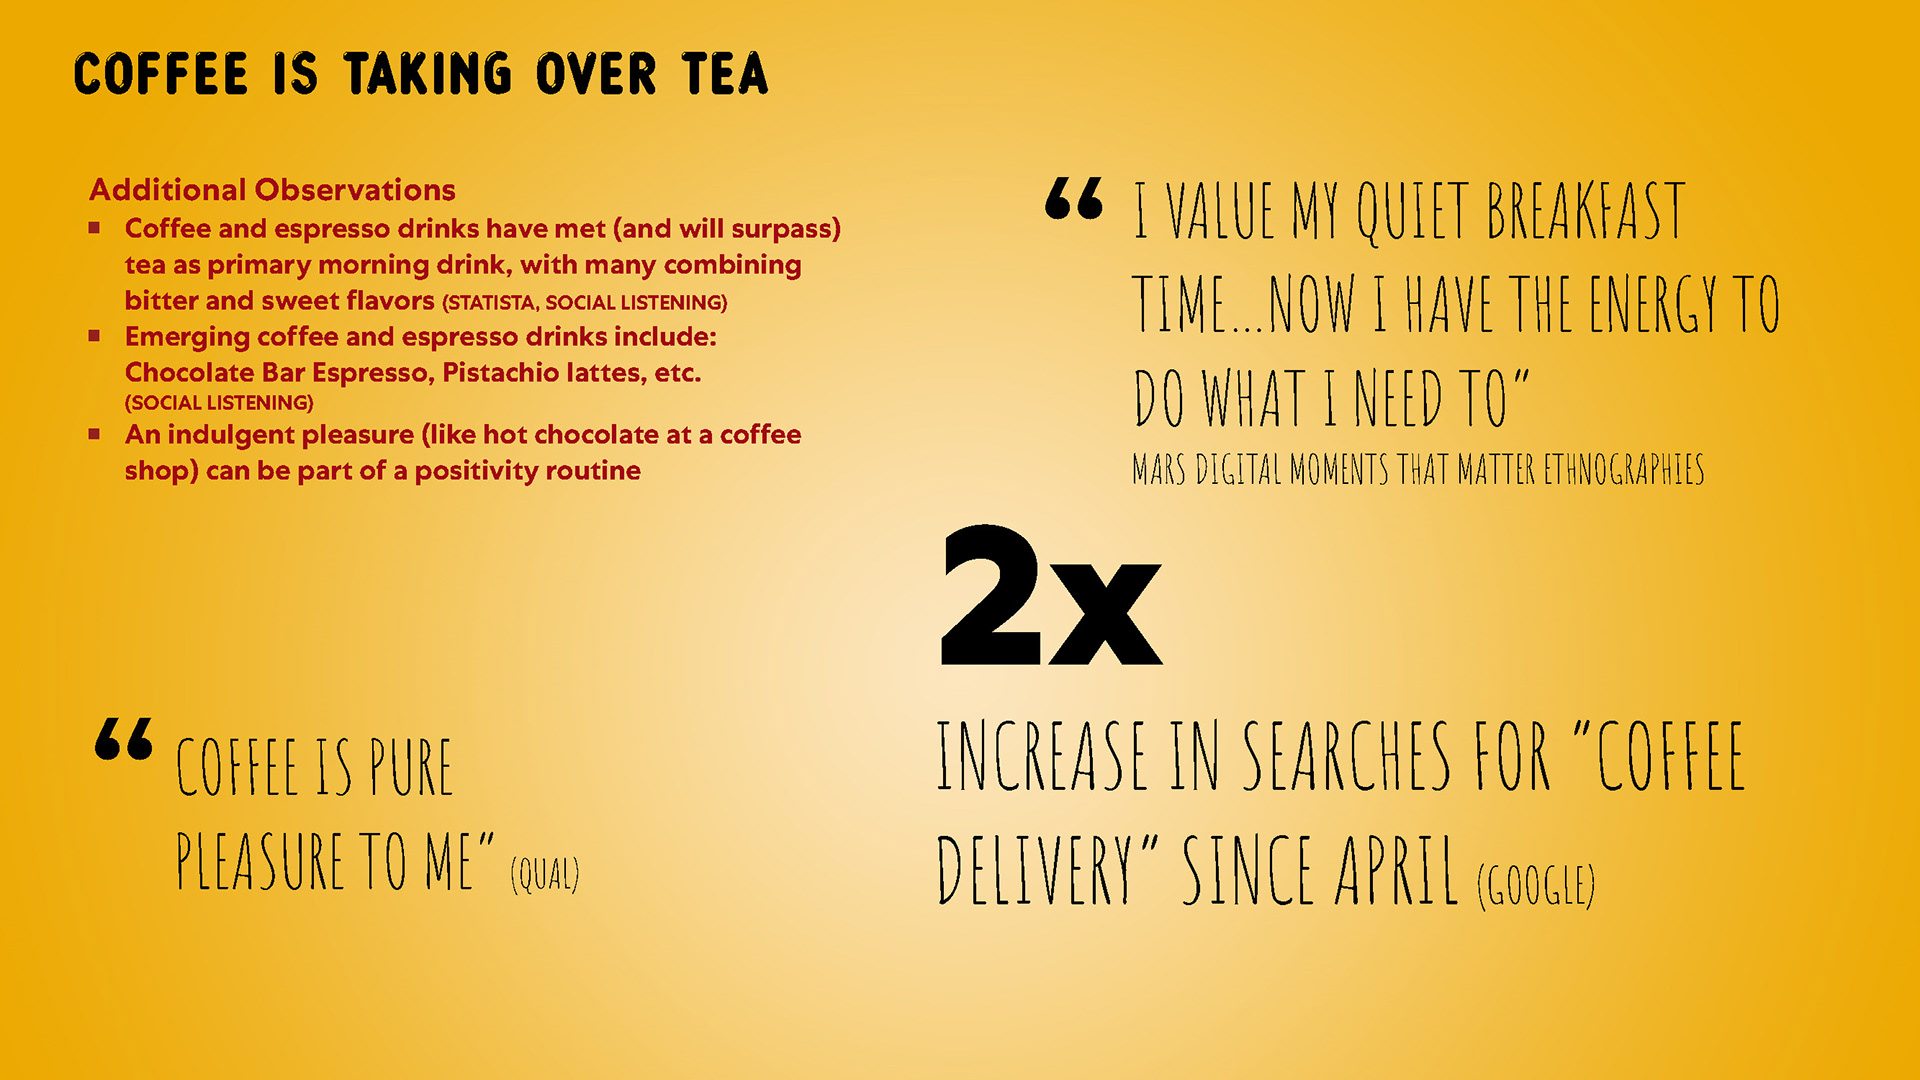
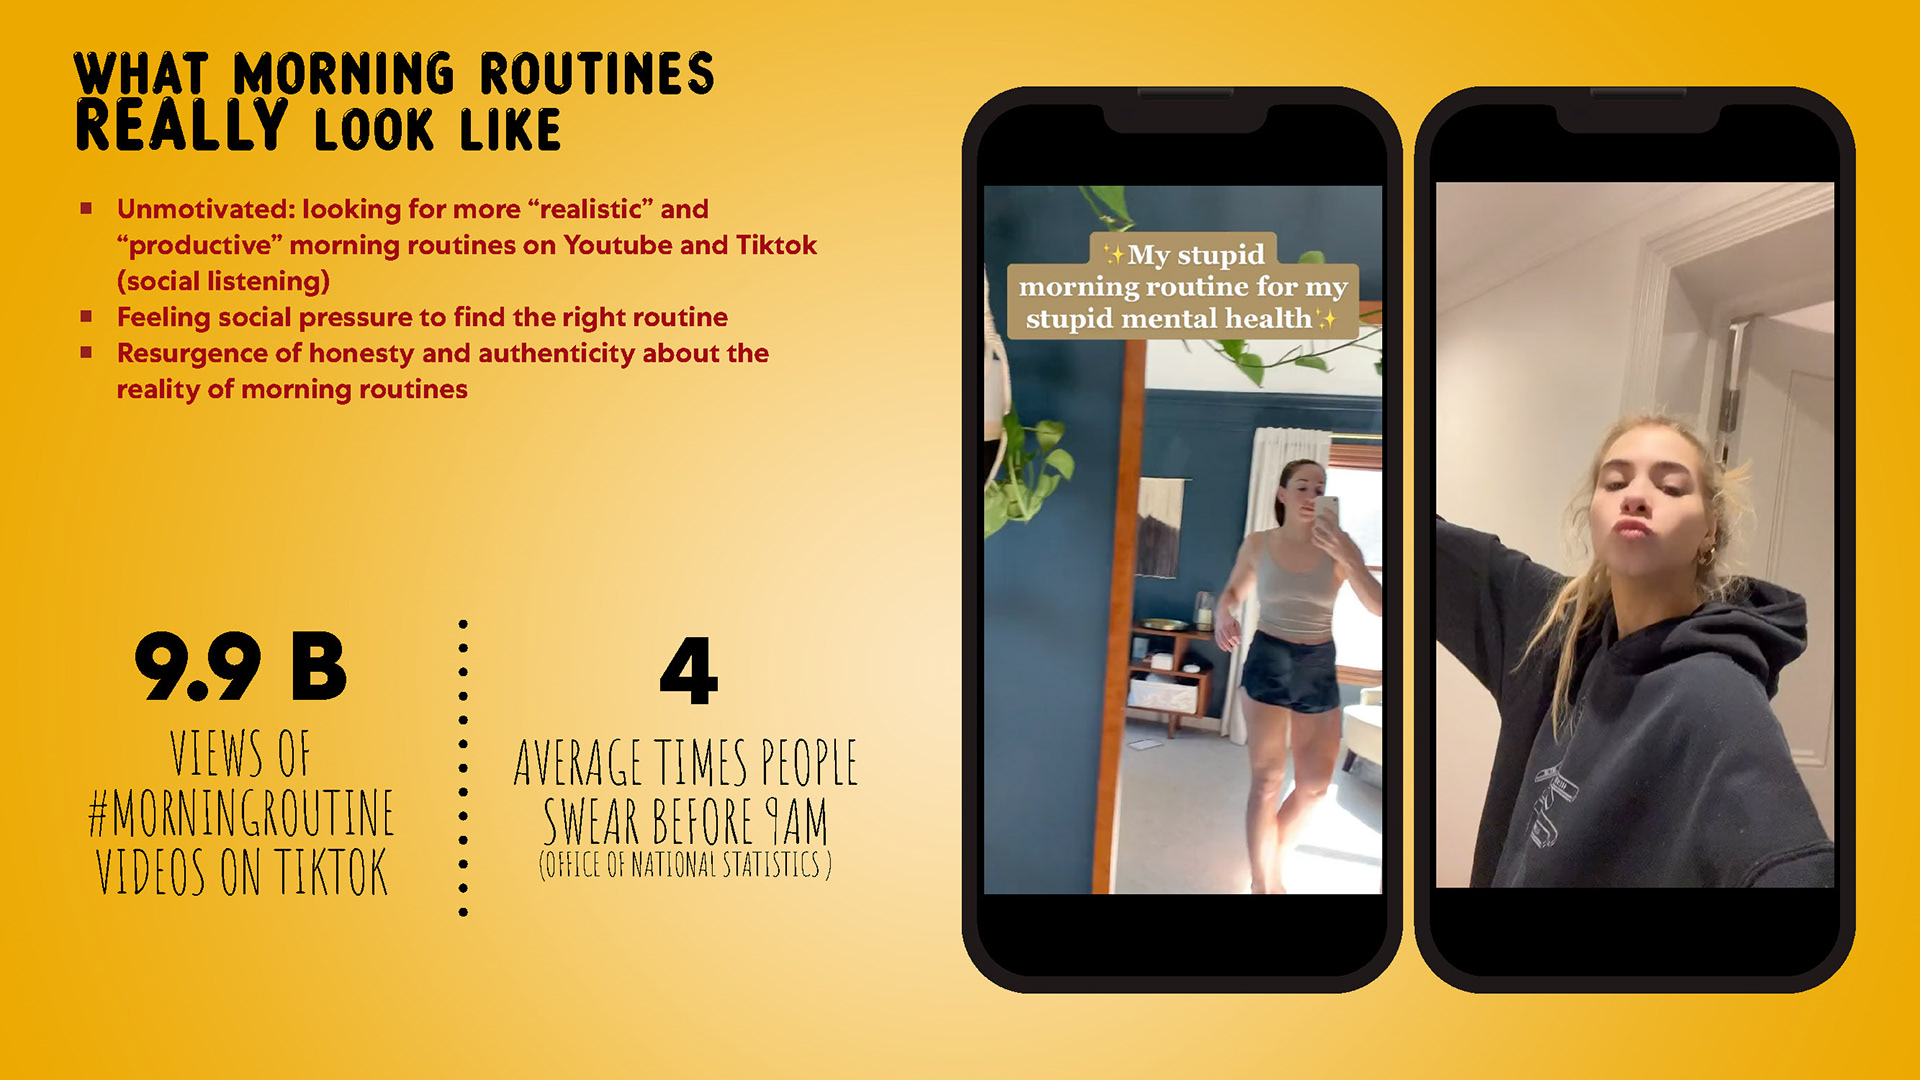
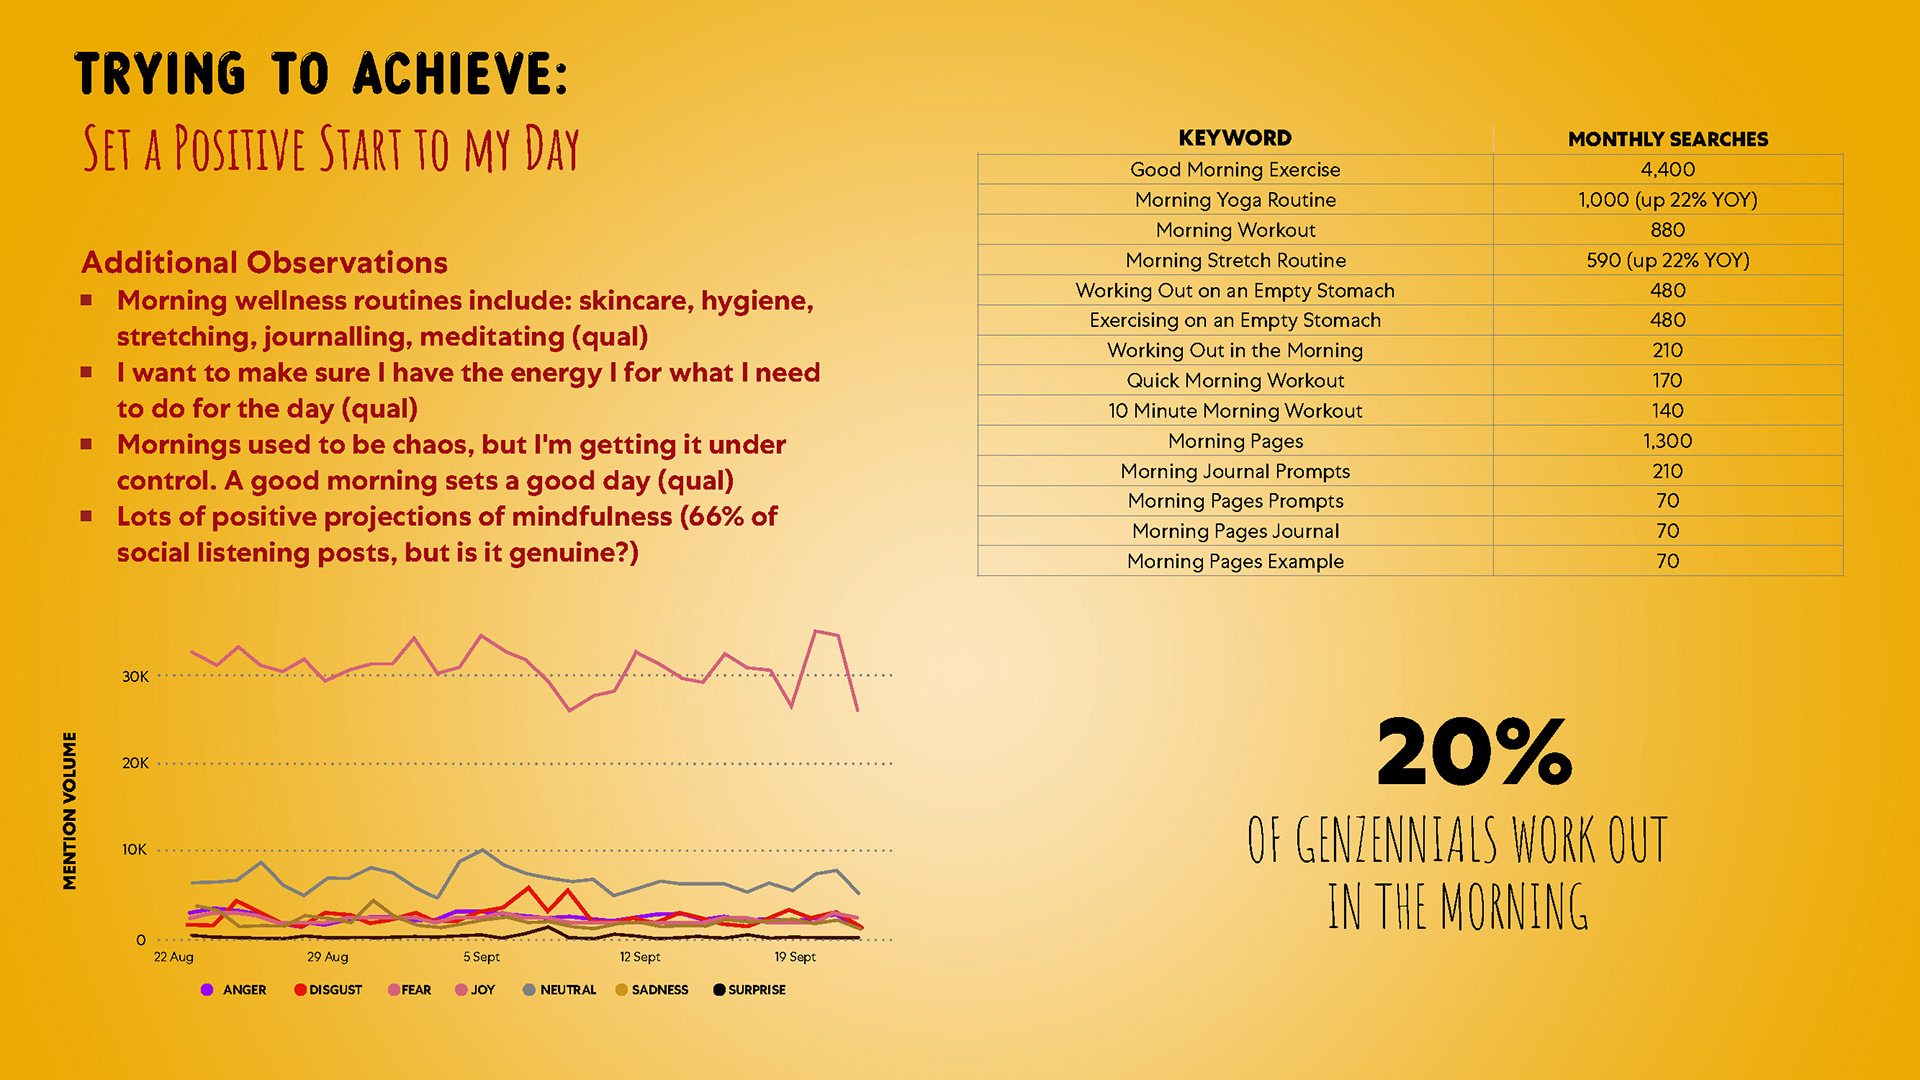
Develop a high-stakes Business-to-Business (B2B) presentation deck for Mars to pitch new strategic initiatives for the UK market. Working as a freelance designer at DDB, the objective was to transform extensive consumer research and market analytics into a persuasive, “pitch-perfect” deck that aligns with the iconic branding of products like Twix.
STRATEGY
I focused on a data-first storytelling approach, translating complex behavioral statistics—such as morning consumer habits and market “roadmaps”—into digestible, high-impact data visualizations. By utilizing a warm, “golden-hour” color palette and integrating macro-photography of the products, I ensured the technical charts and graphs felt like a seamless part of the brand’s visual universe. This strategy turned dense information into a series of “ah-ha” moments, using custom infographics and clean typographic hierarchies to keep the audience engaged and focused on key growth opportunities.
CLIENT


CORPORATE NARRATIVE AUDIENCE DATA
PRESENTATION DECK DESIGN CONCEPT, LAYOUT, TYPOGRAPHY, AND DATA VISUALIZATION
Project DATE | 2018
BRIEF
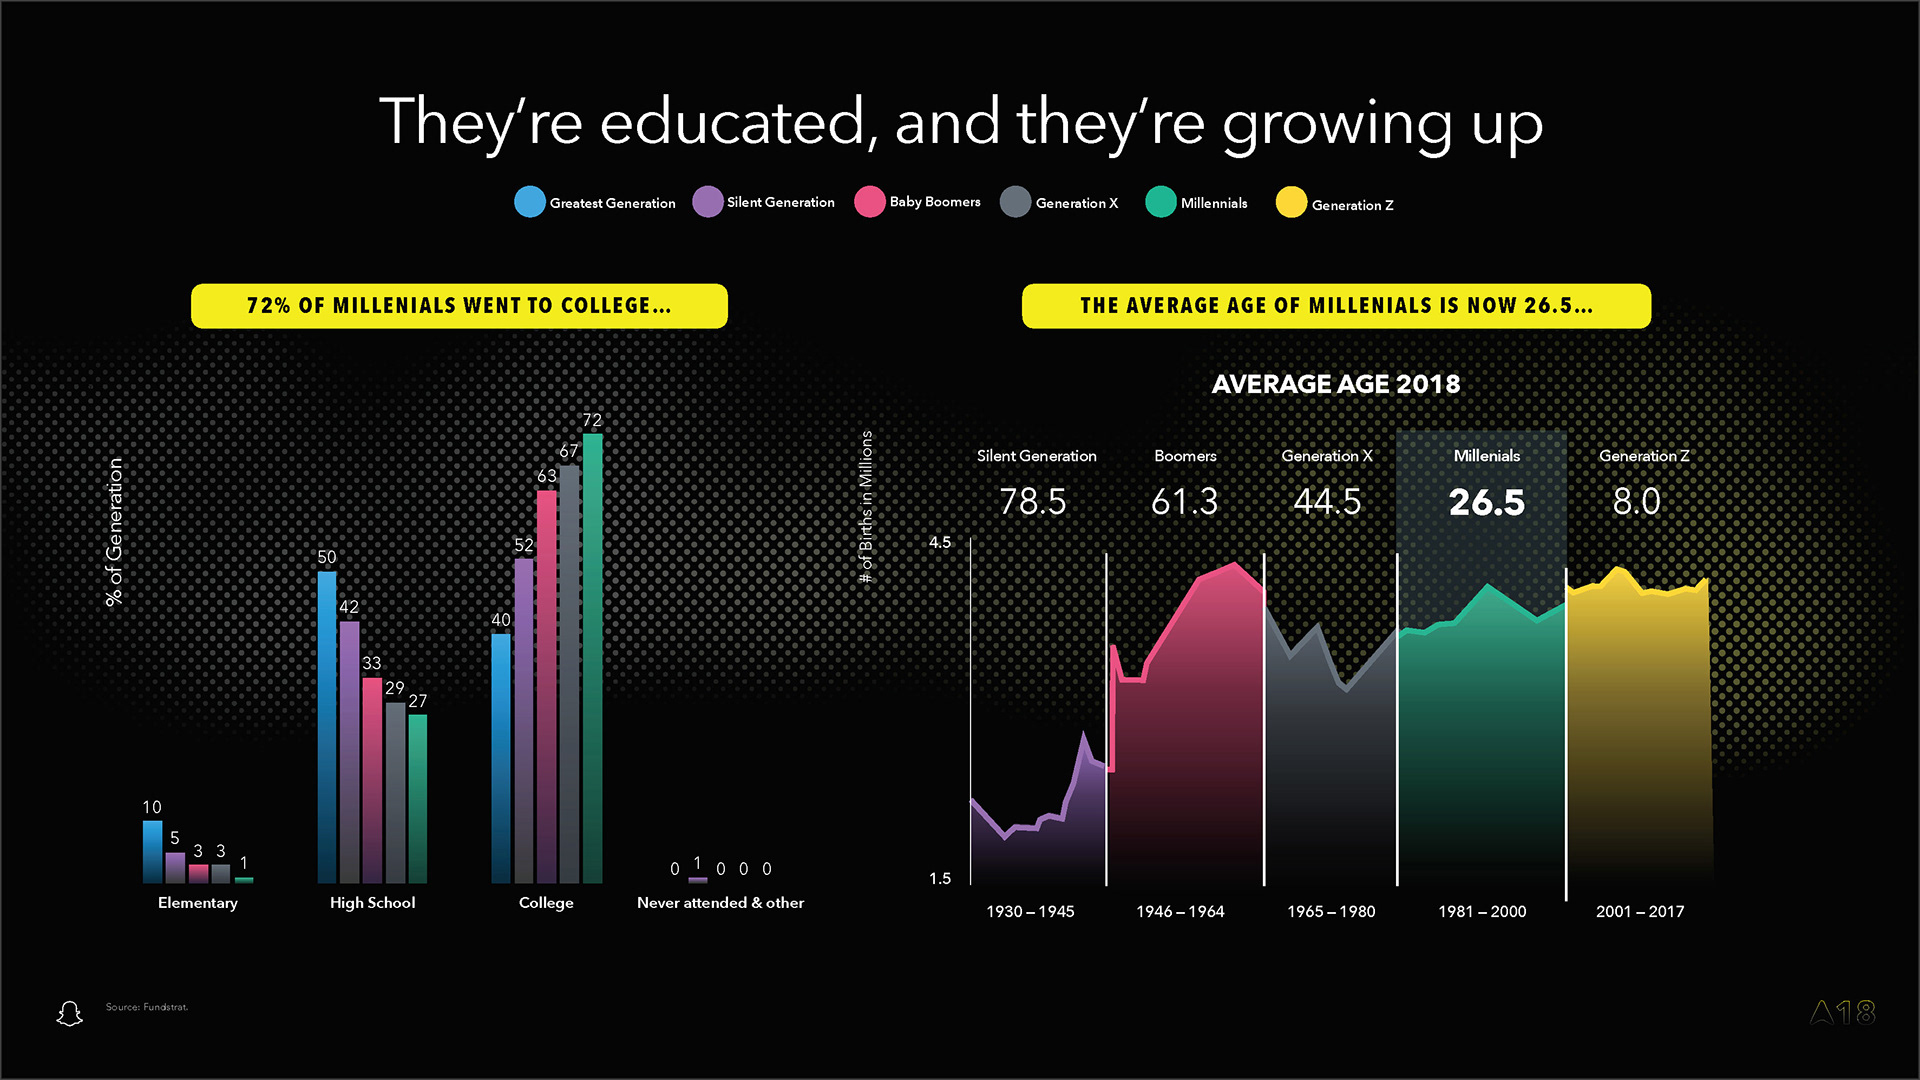
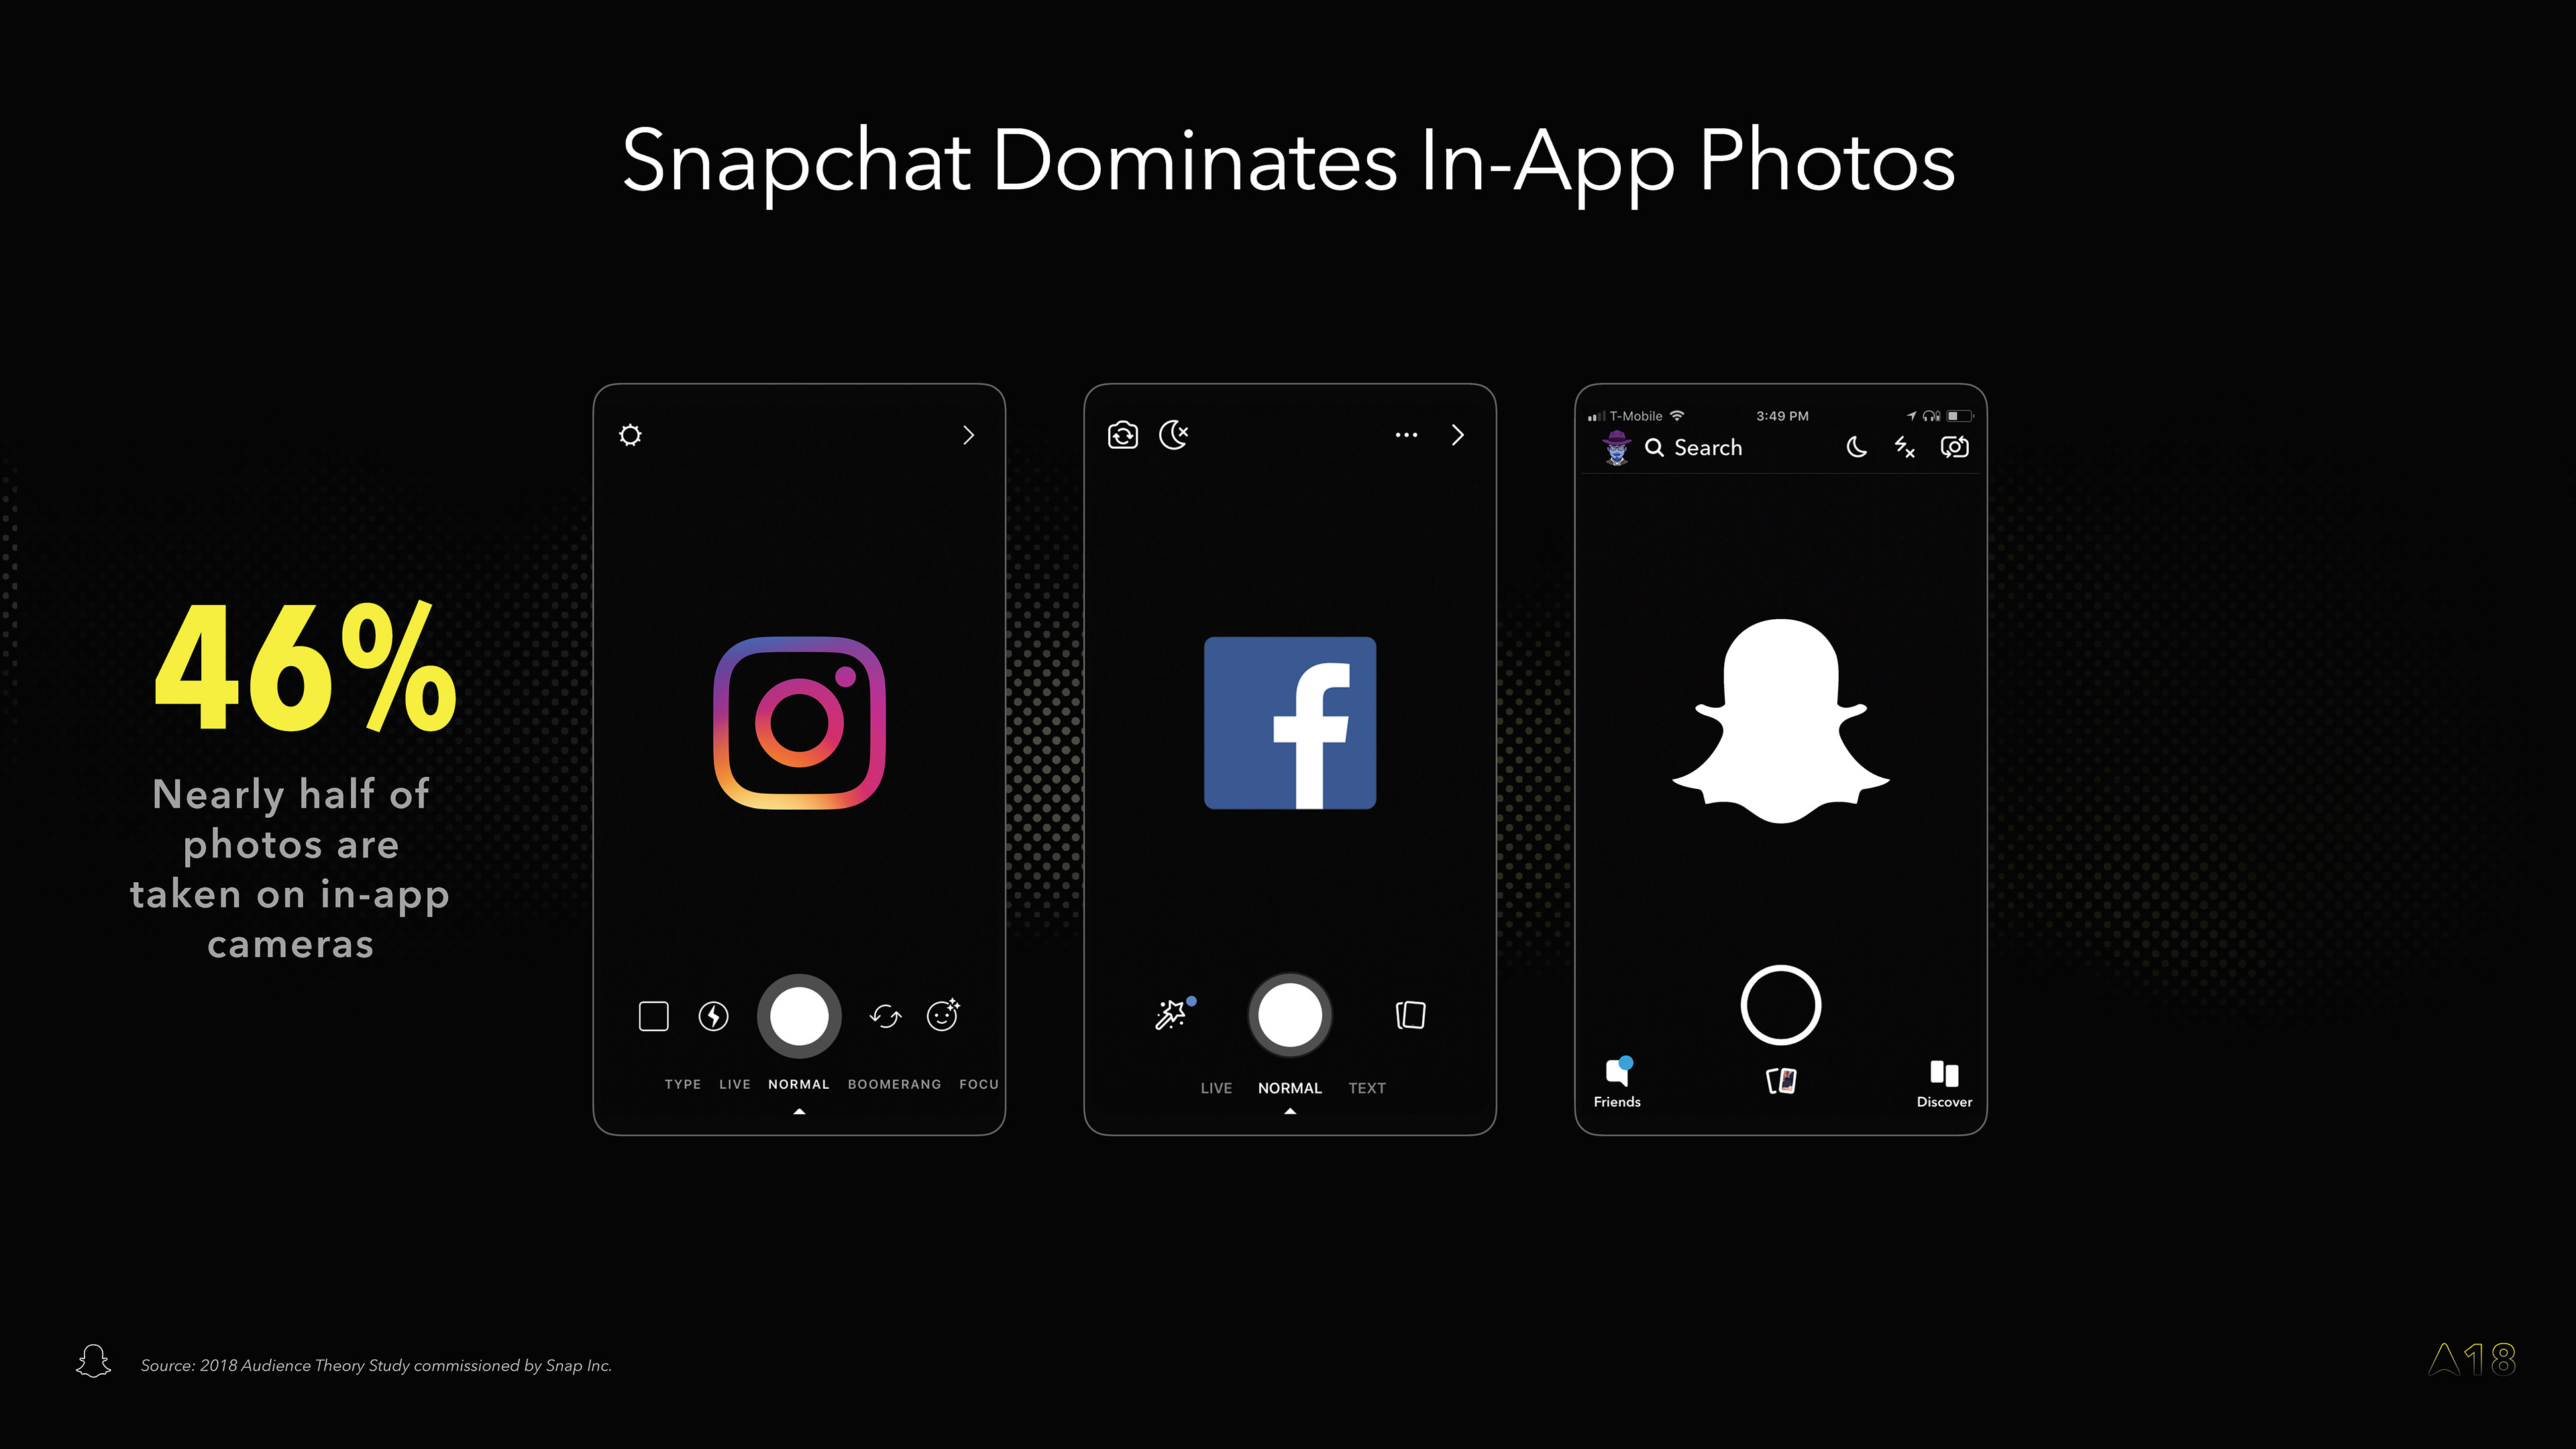
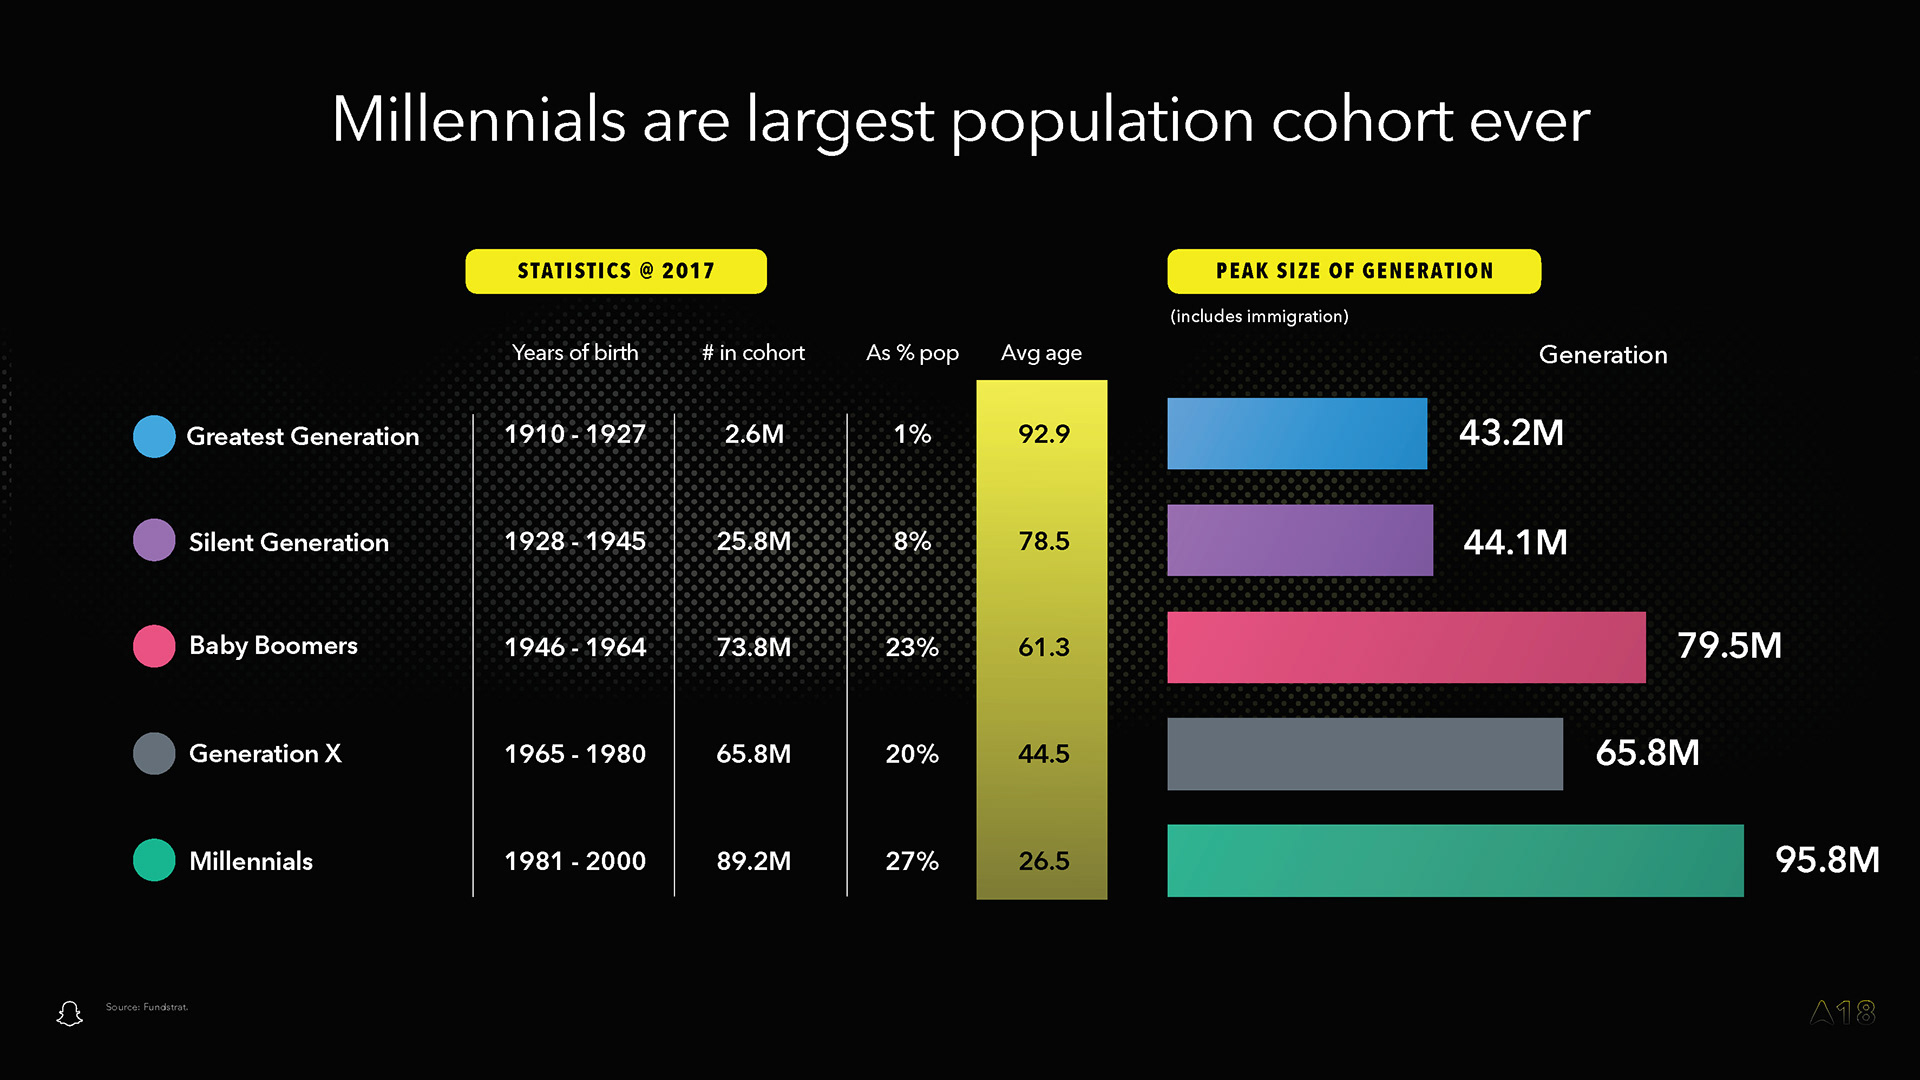
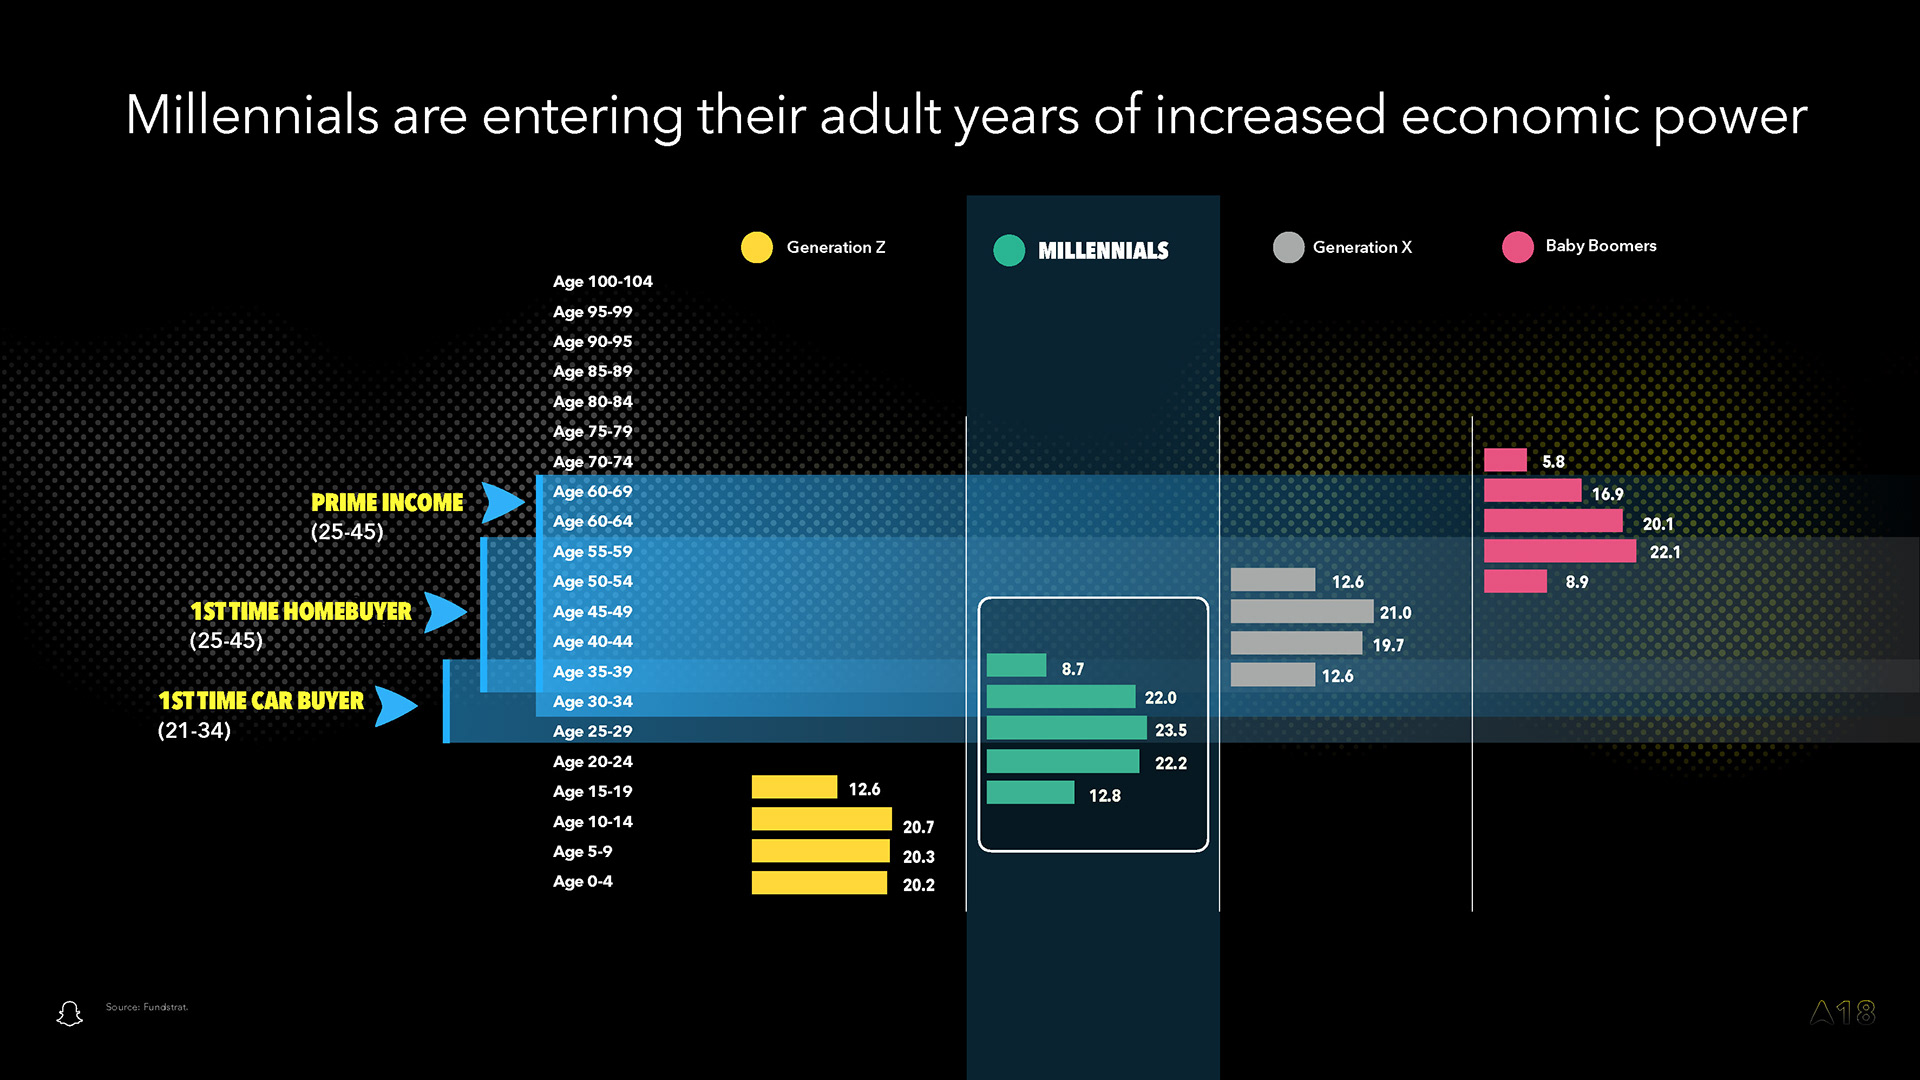
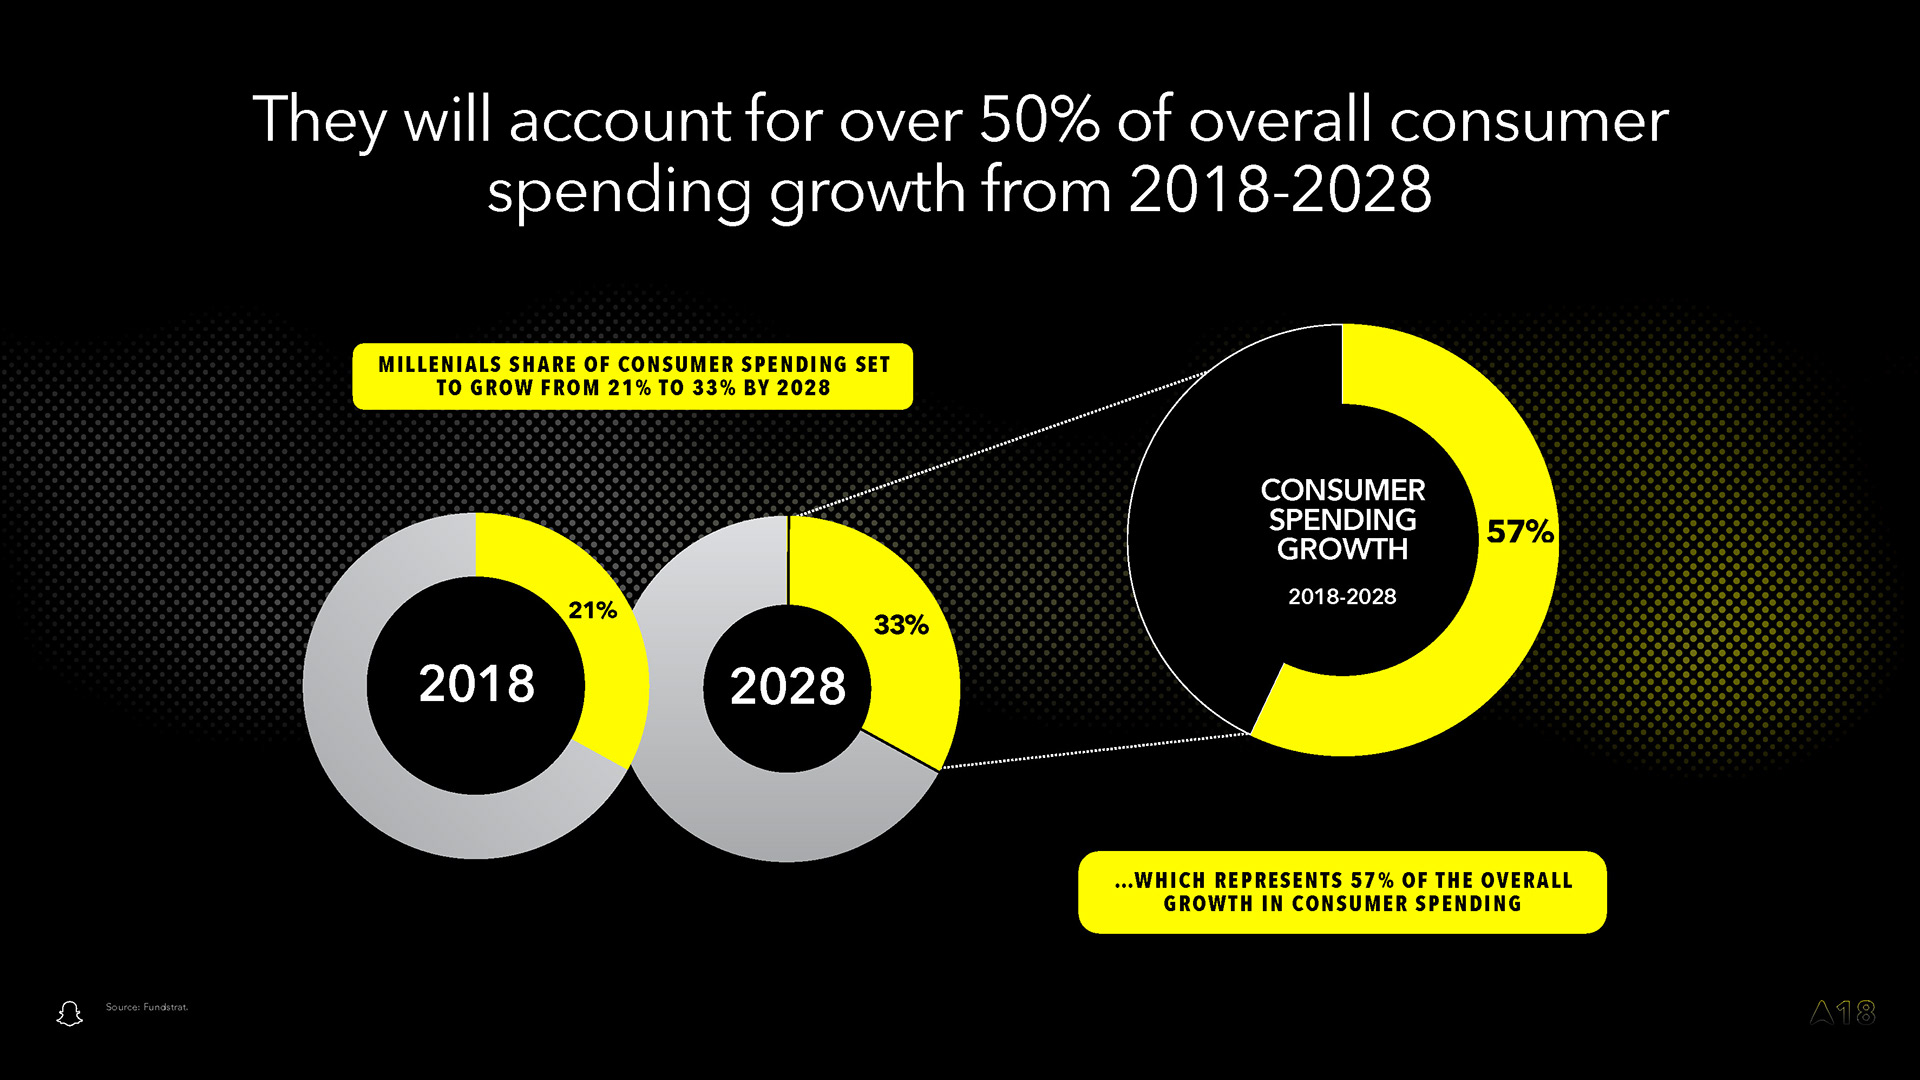
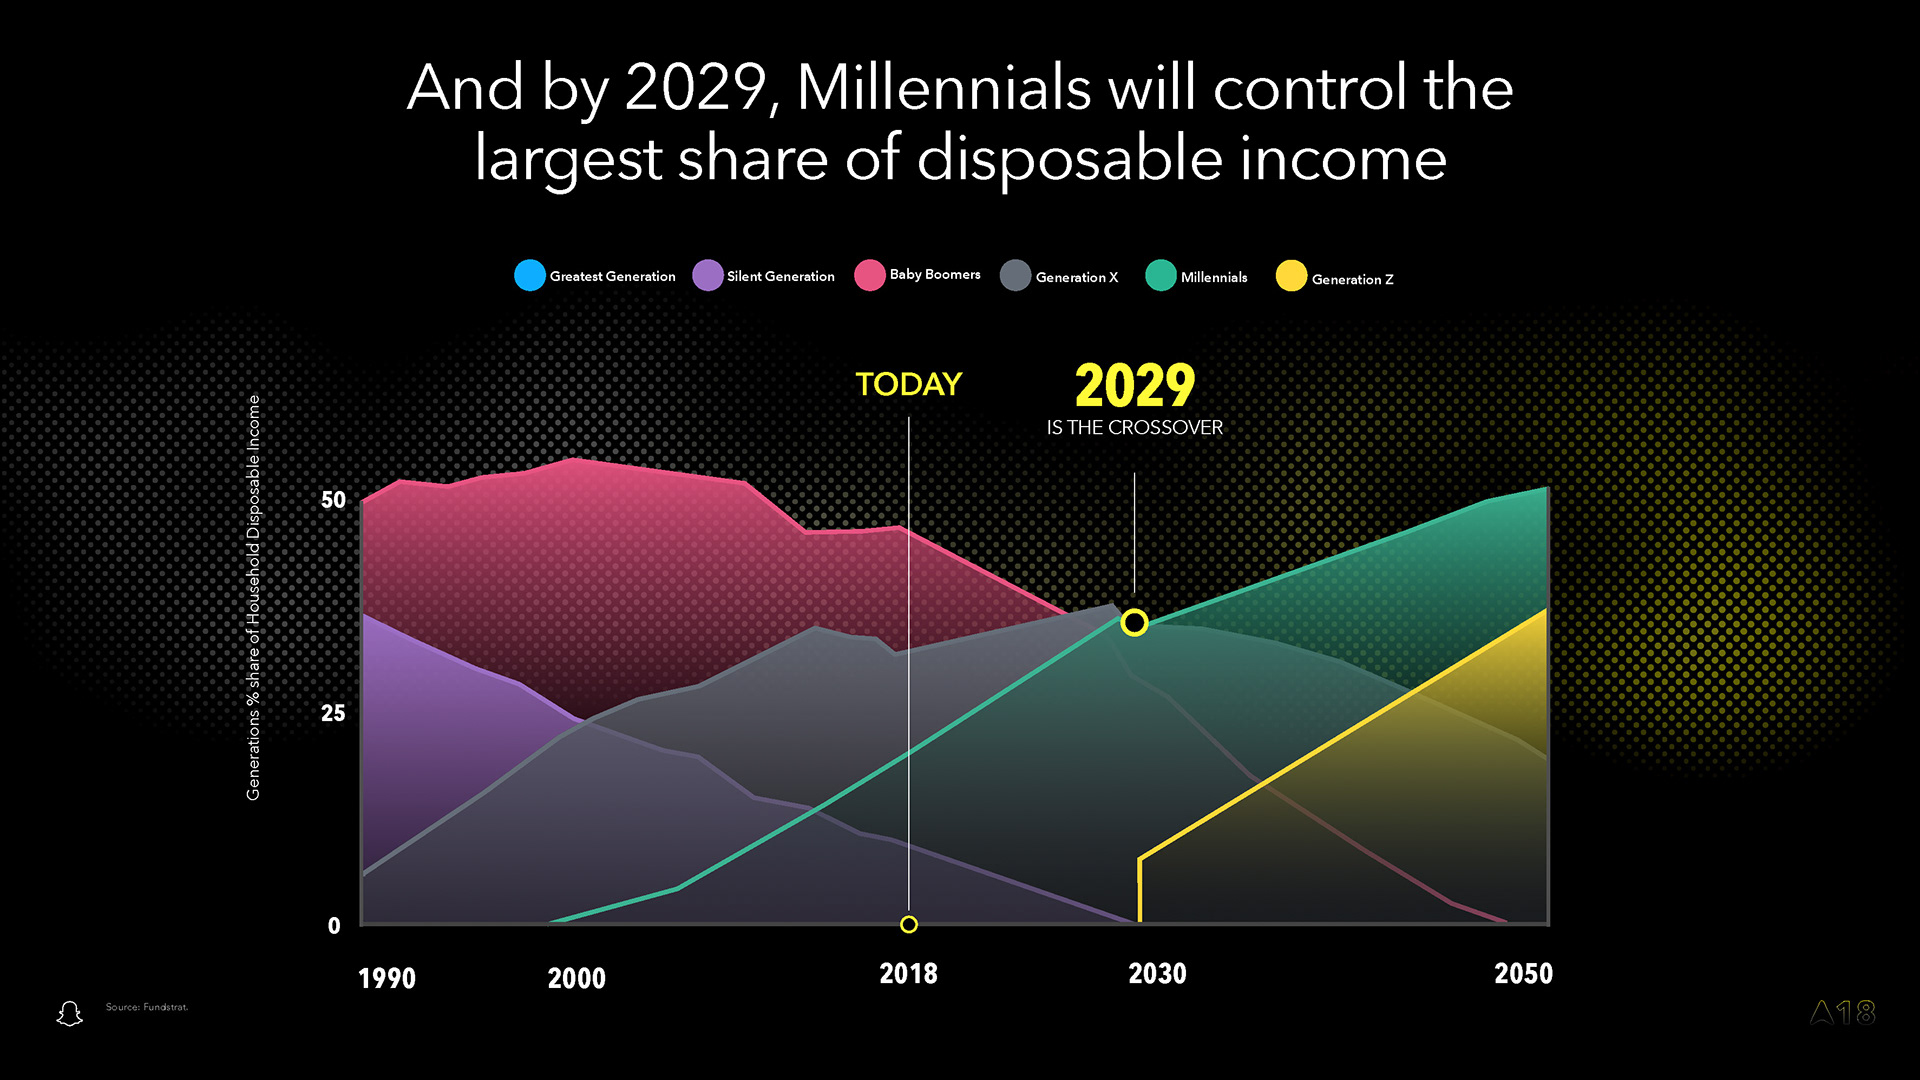
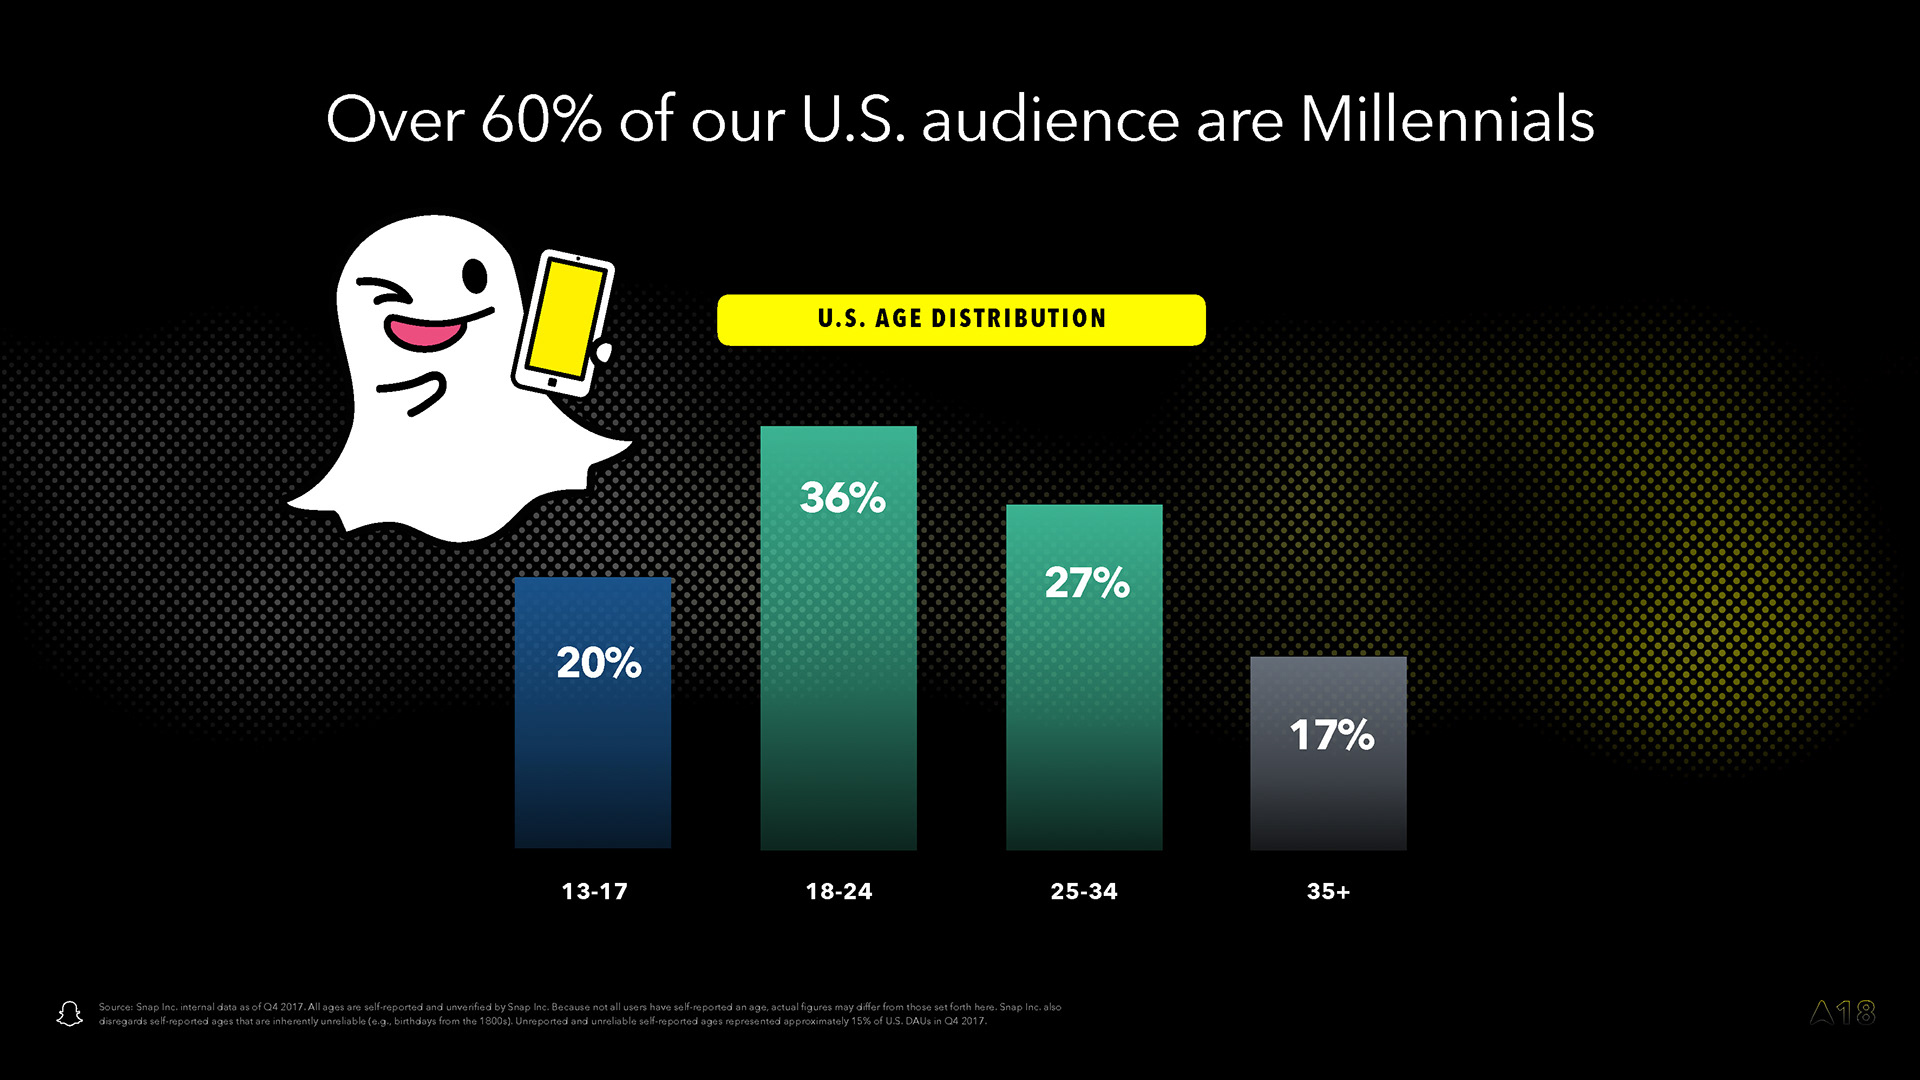
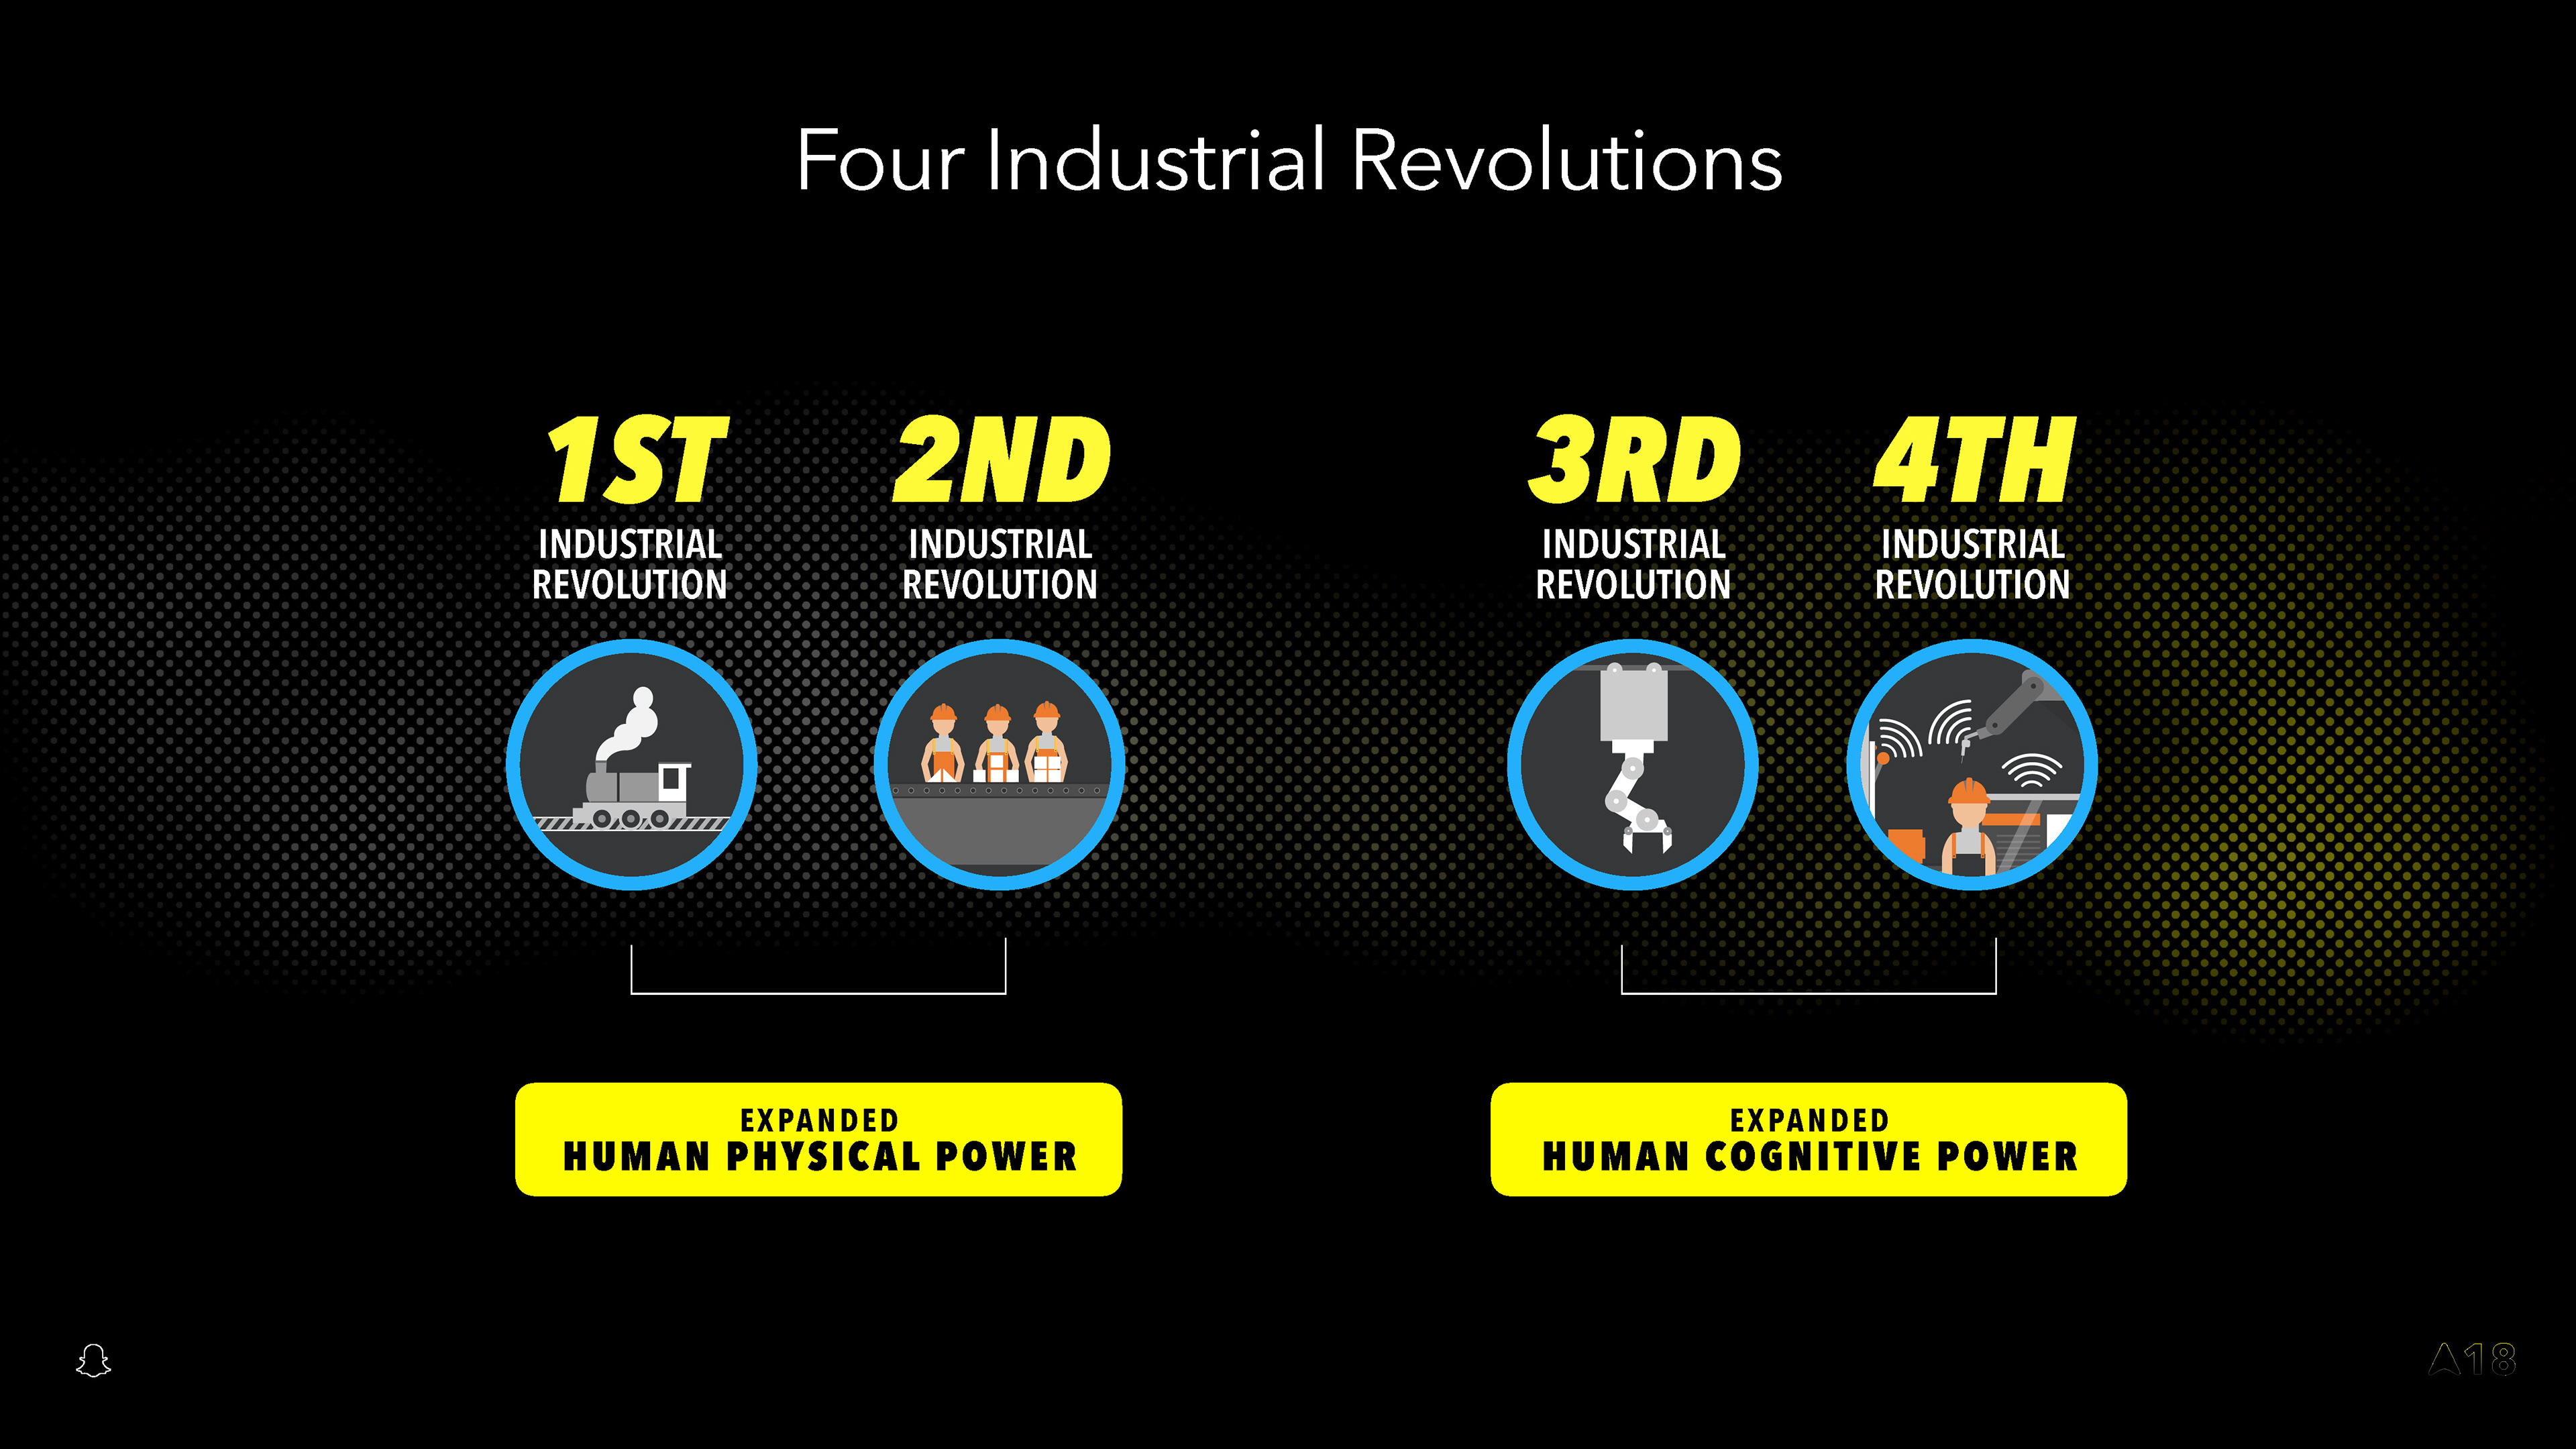
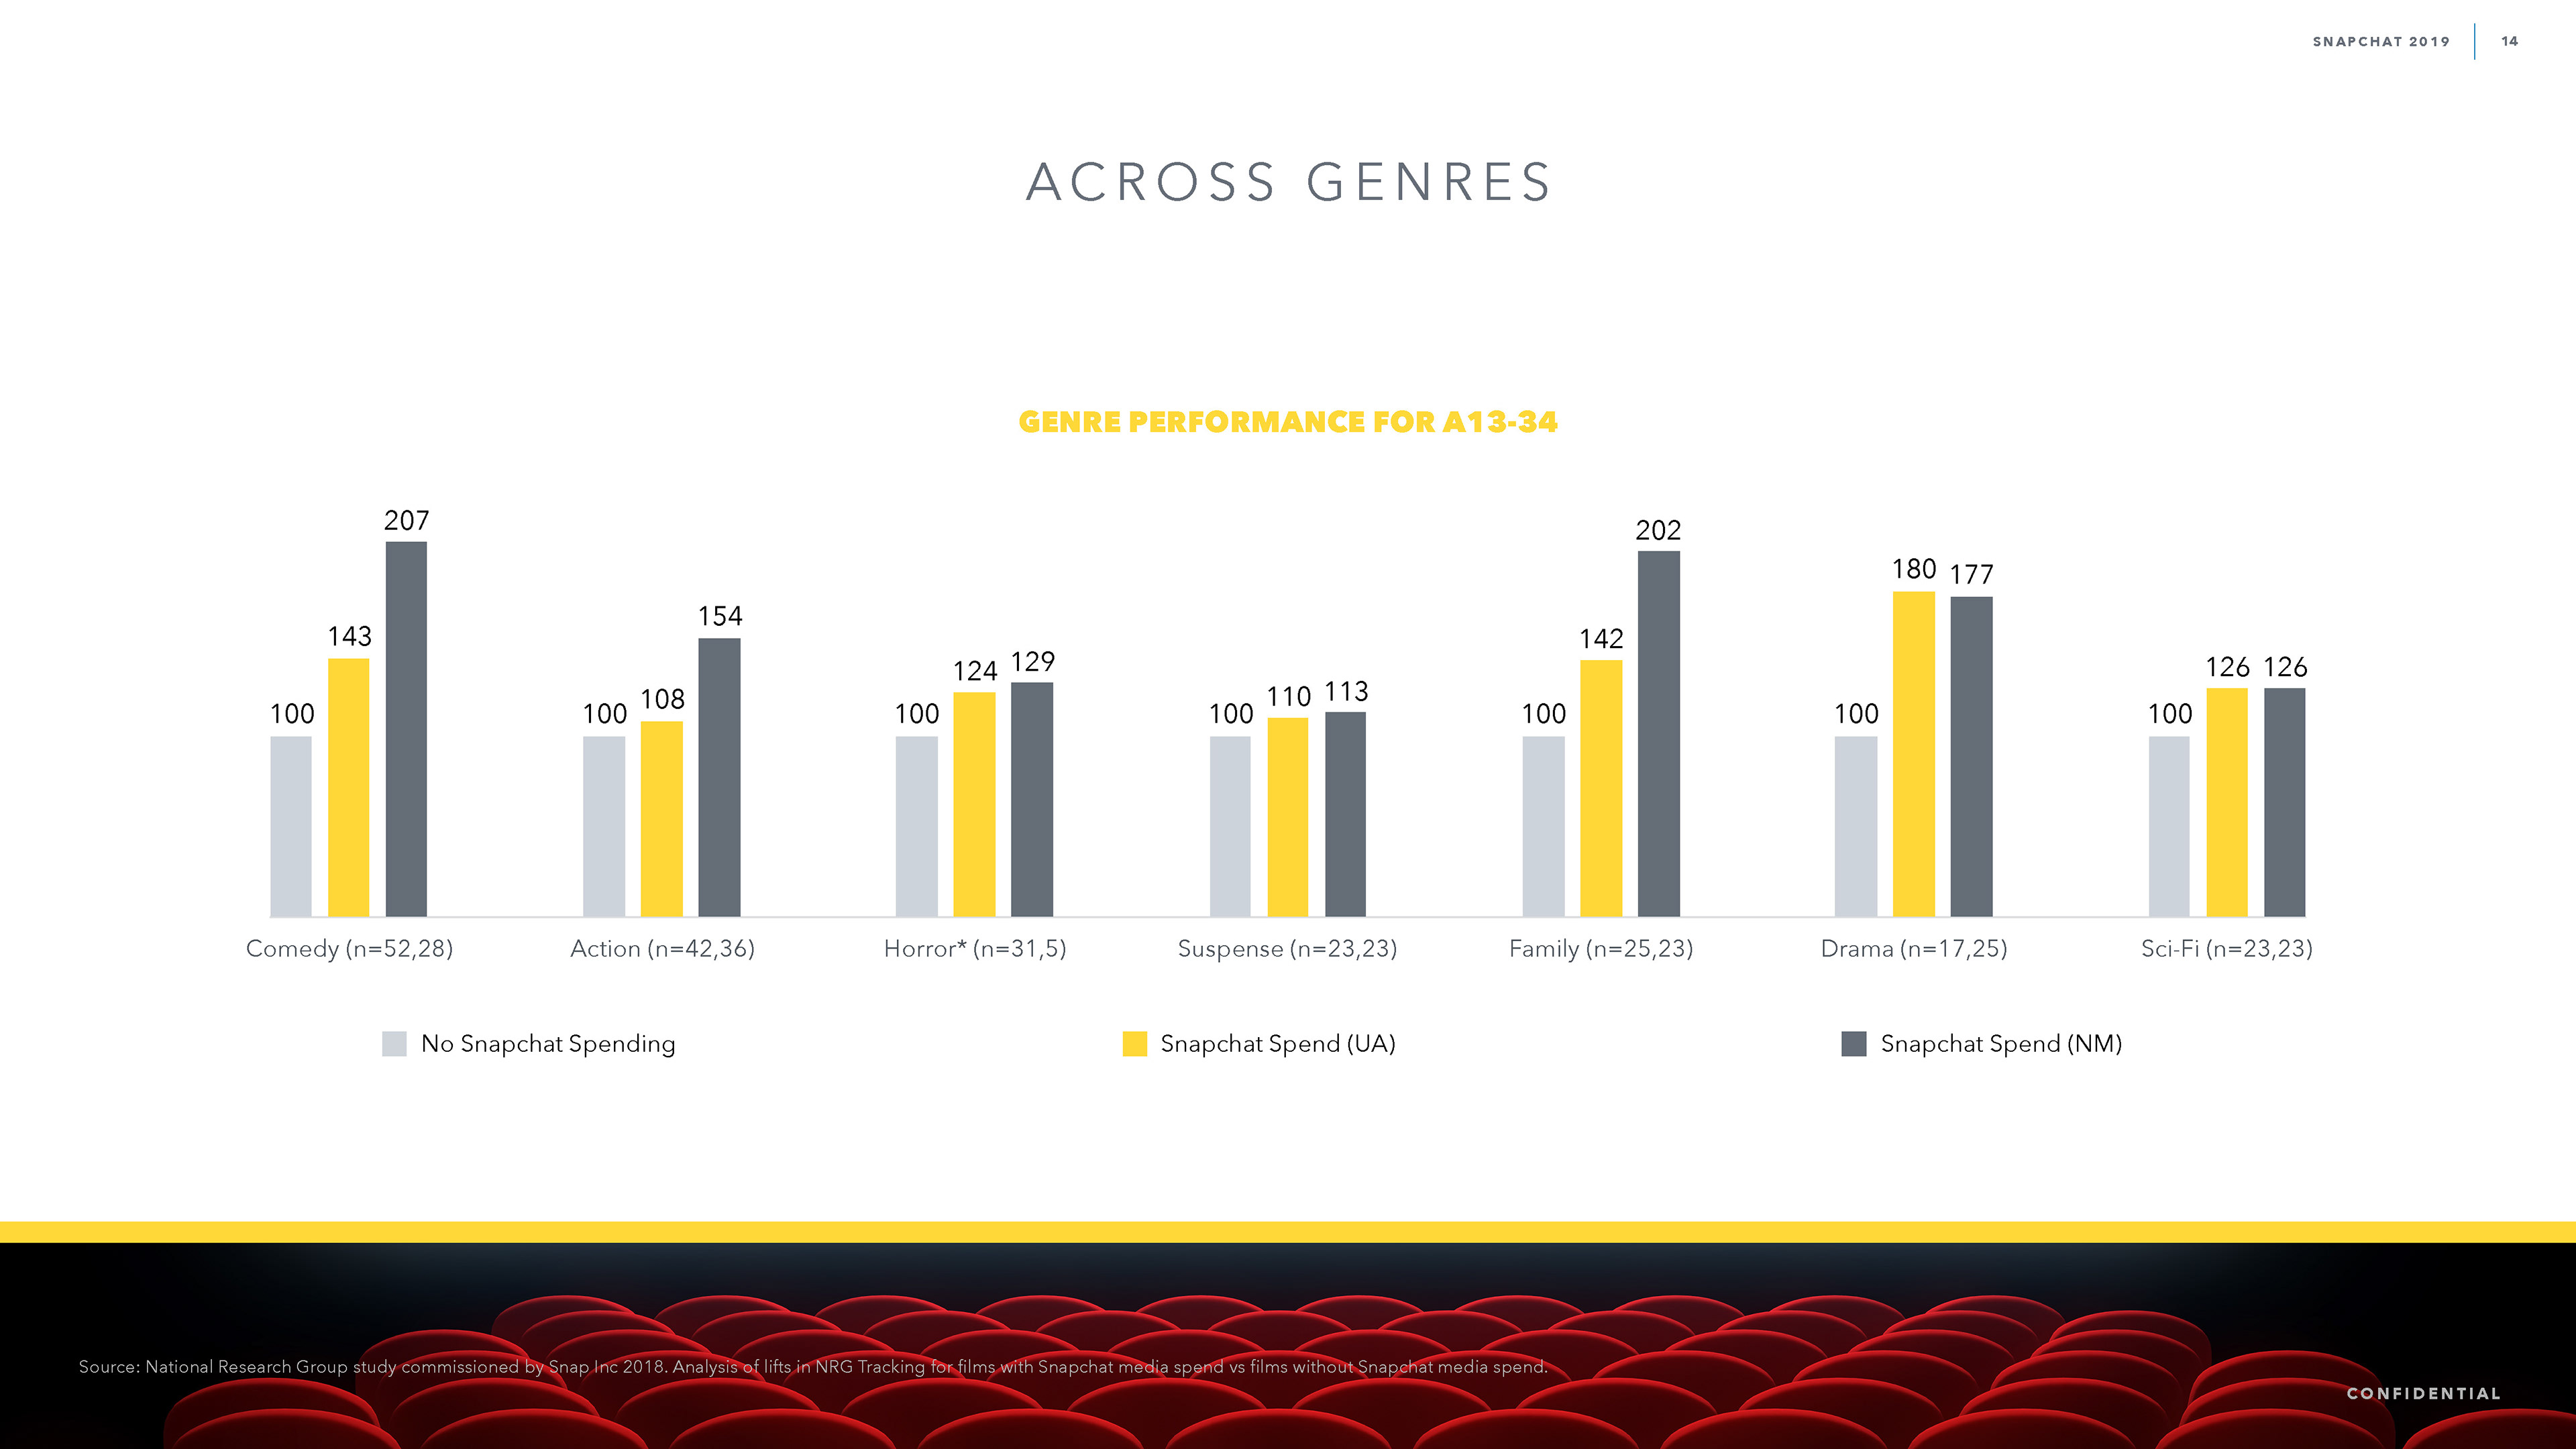
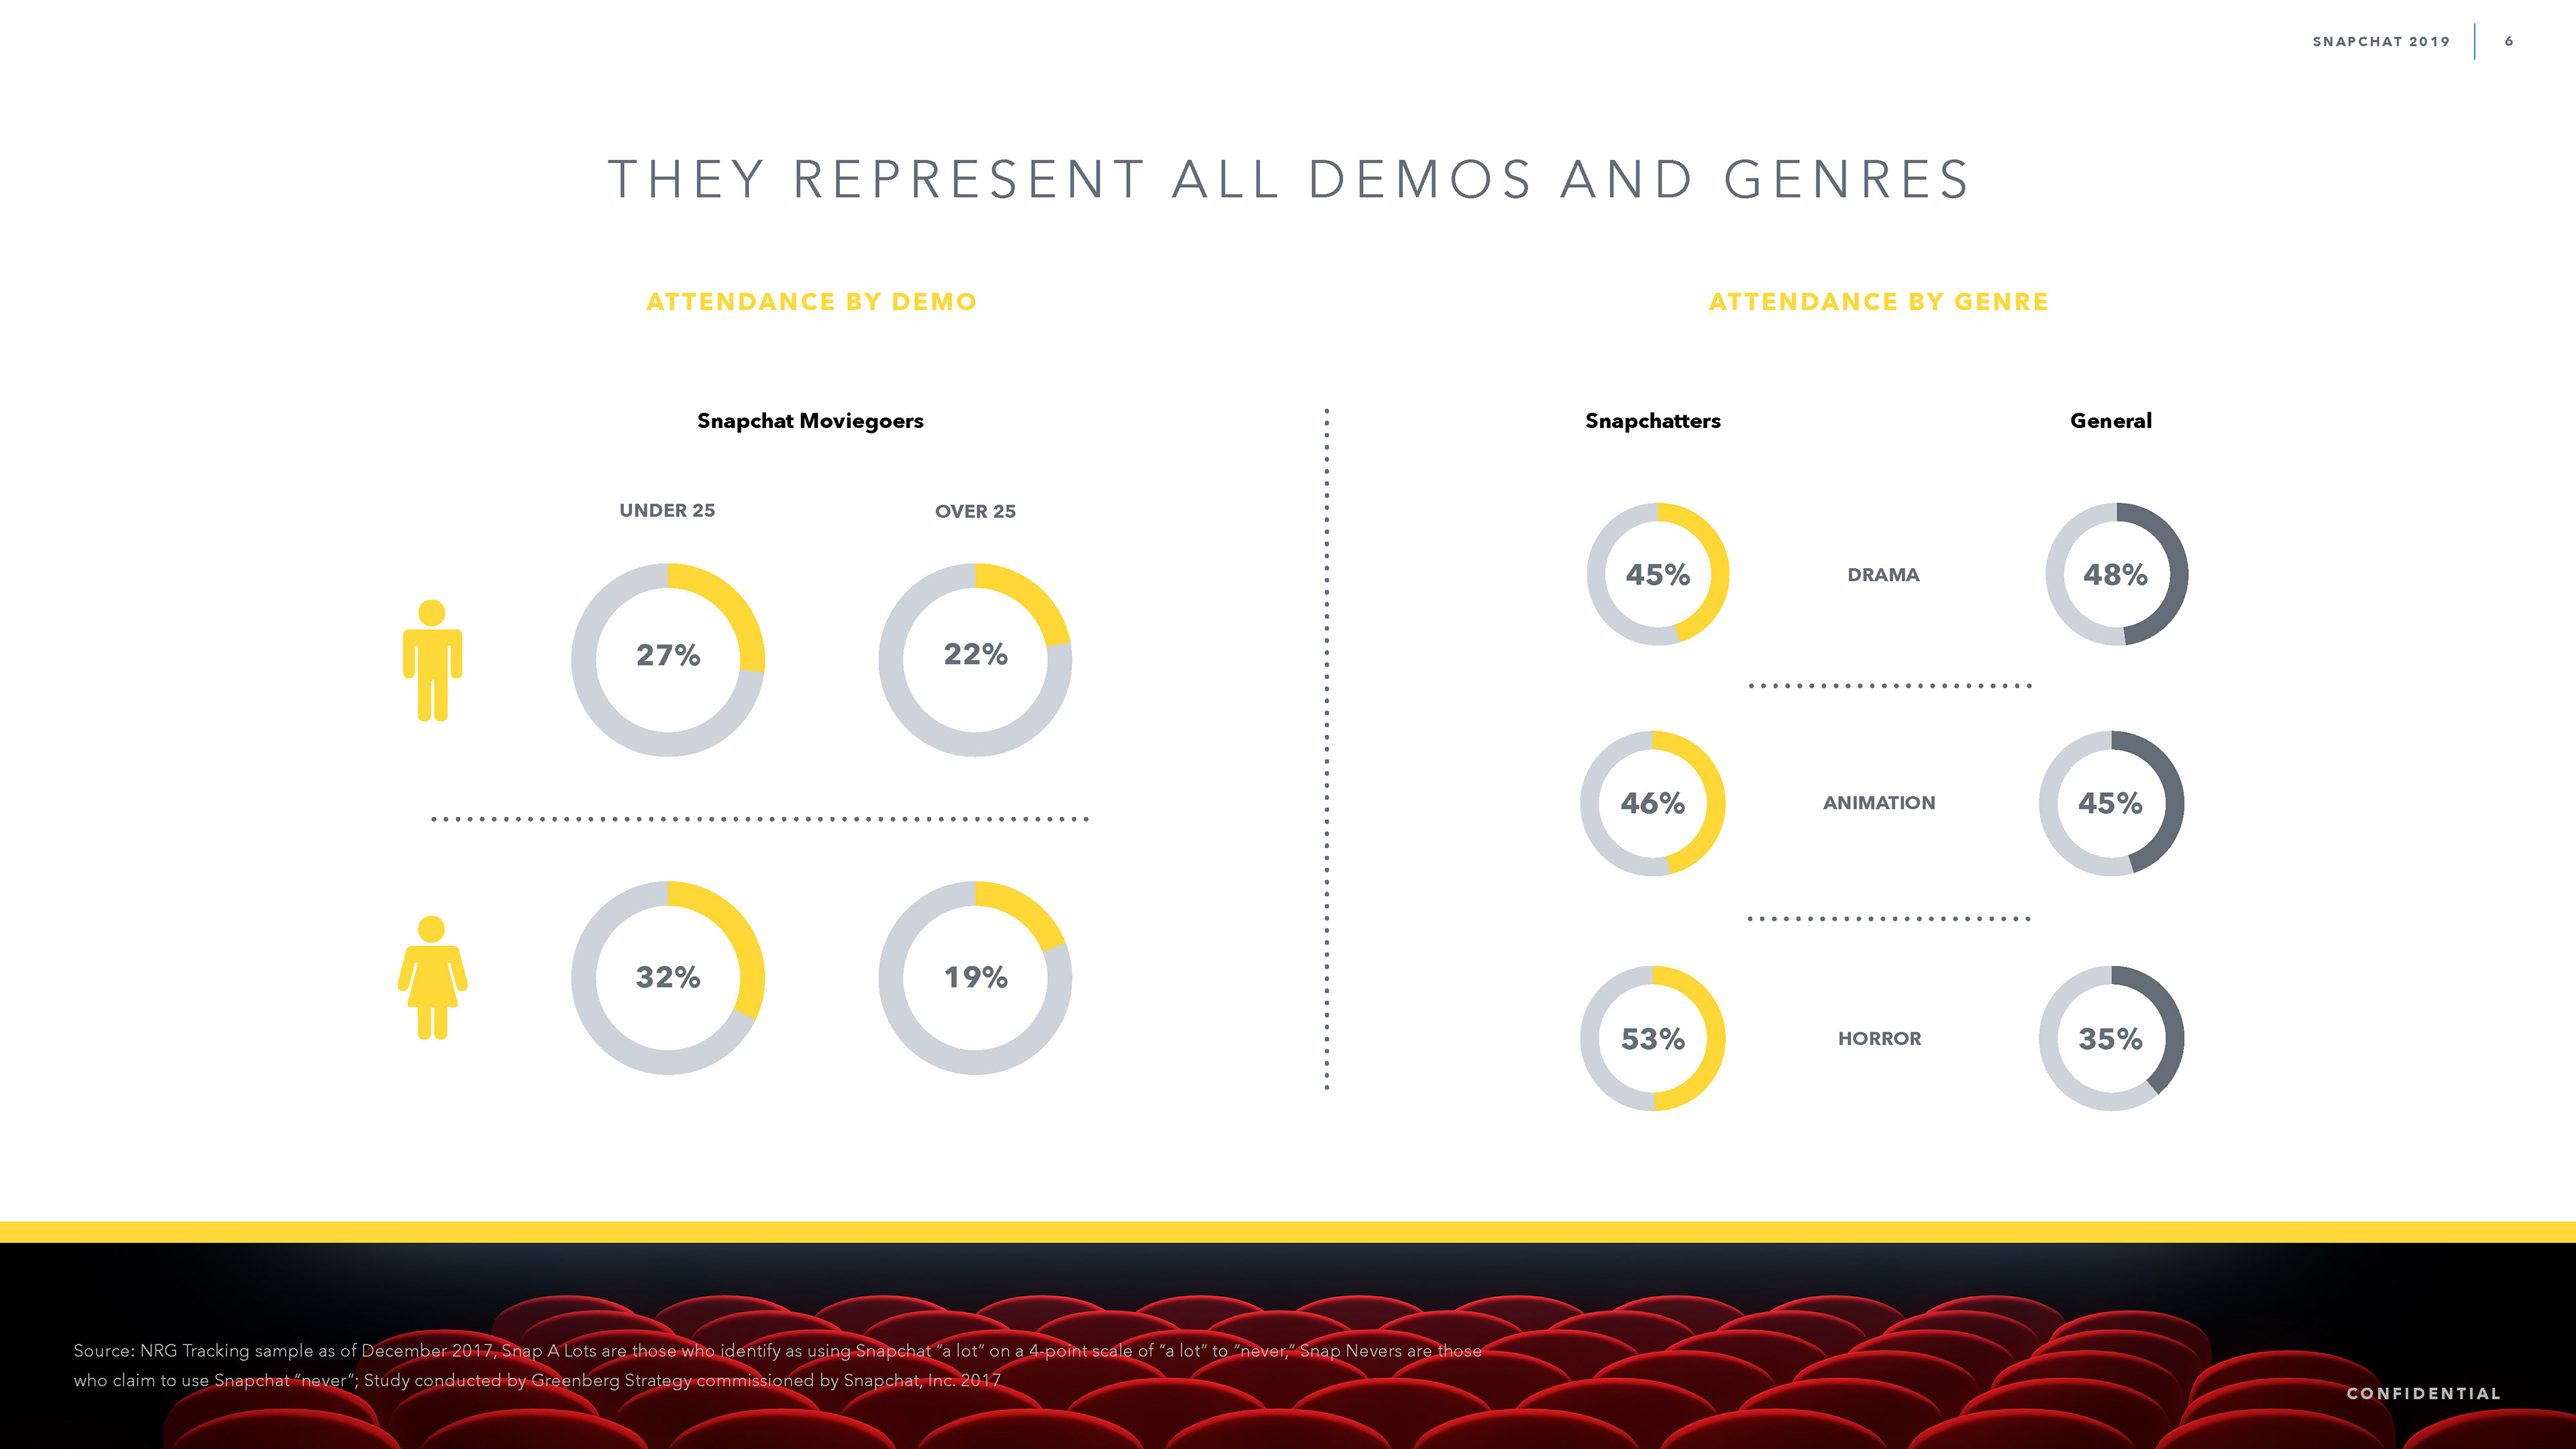
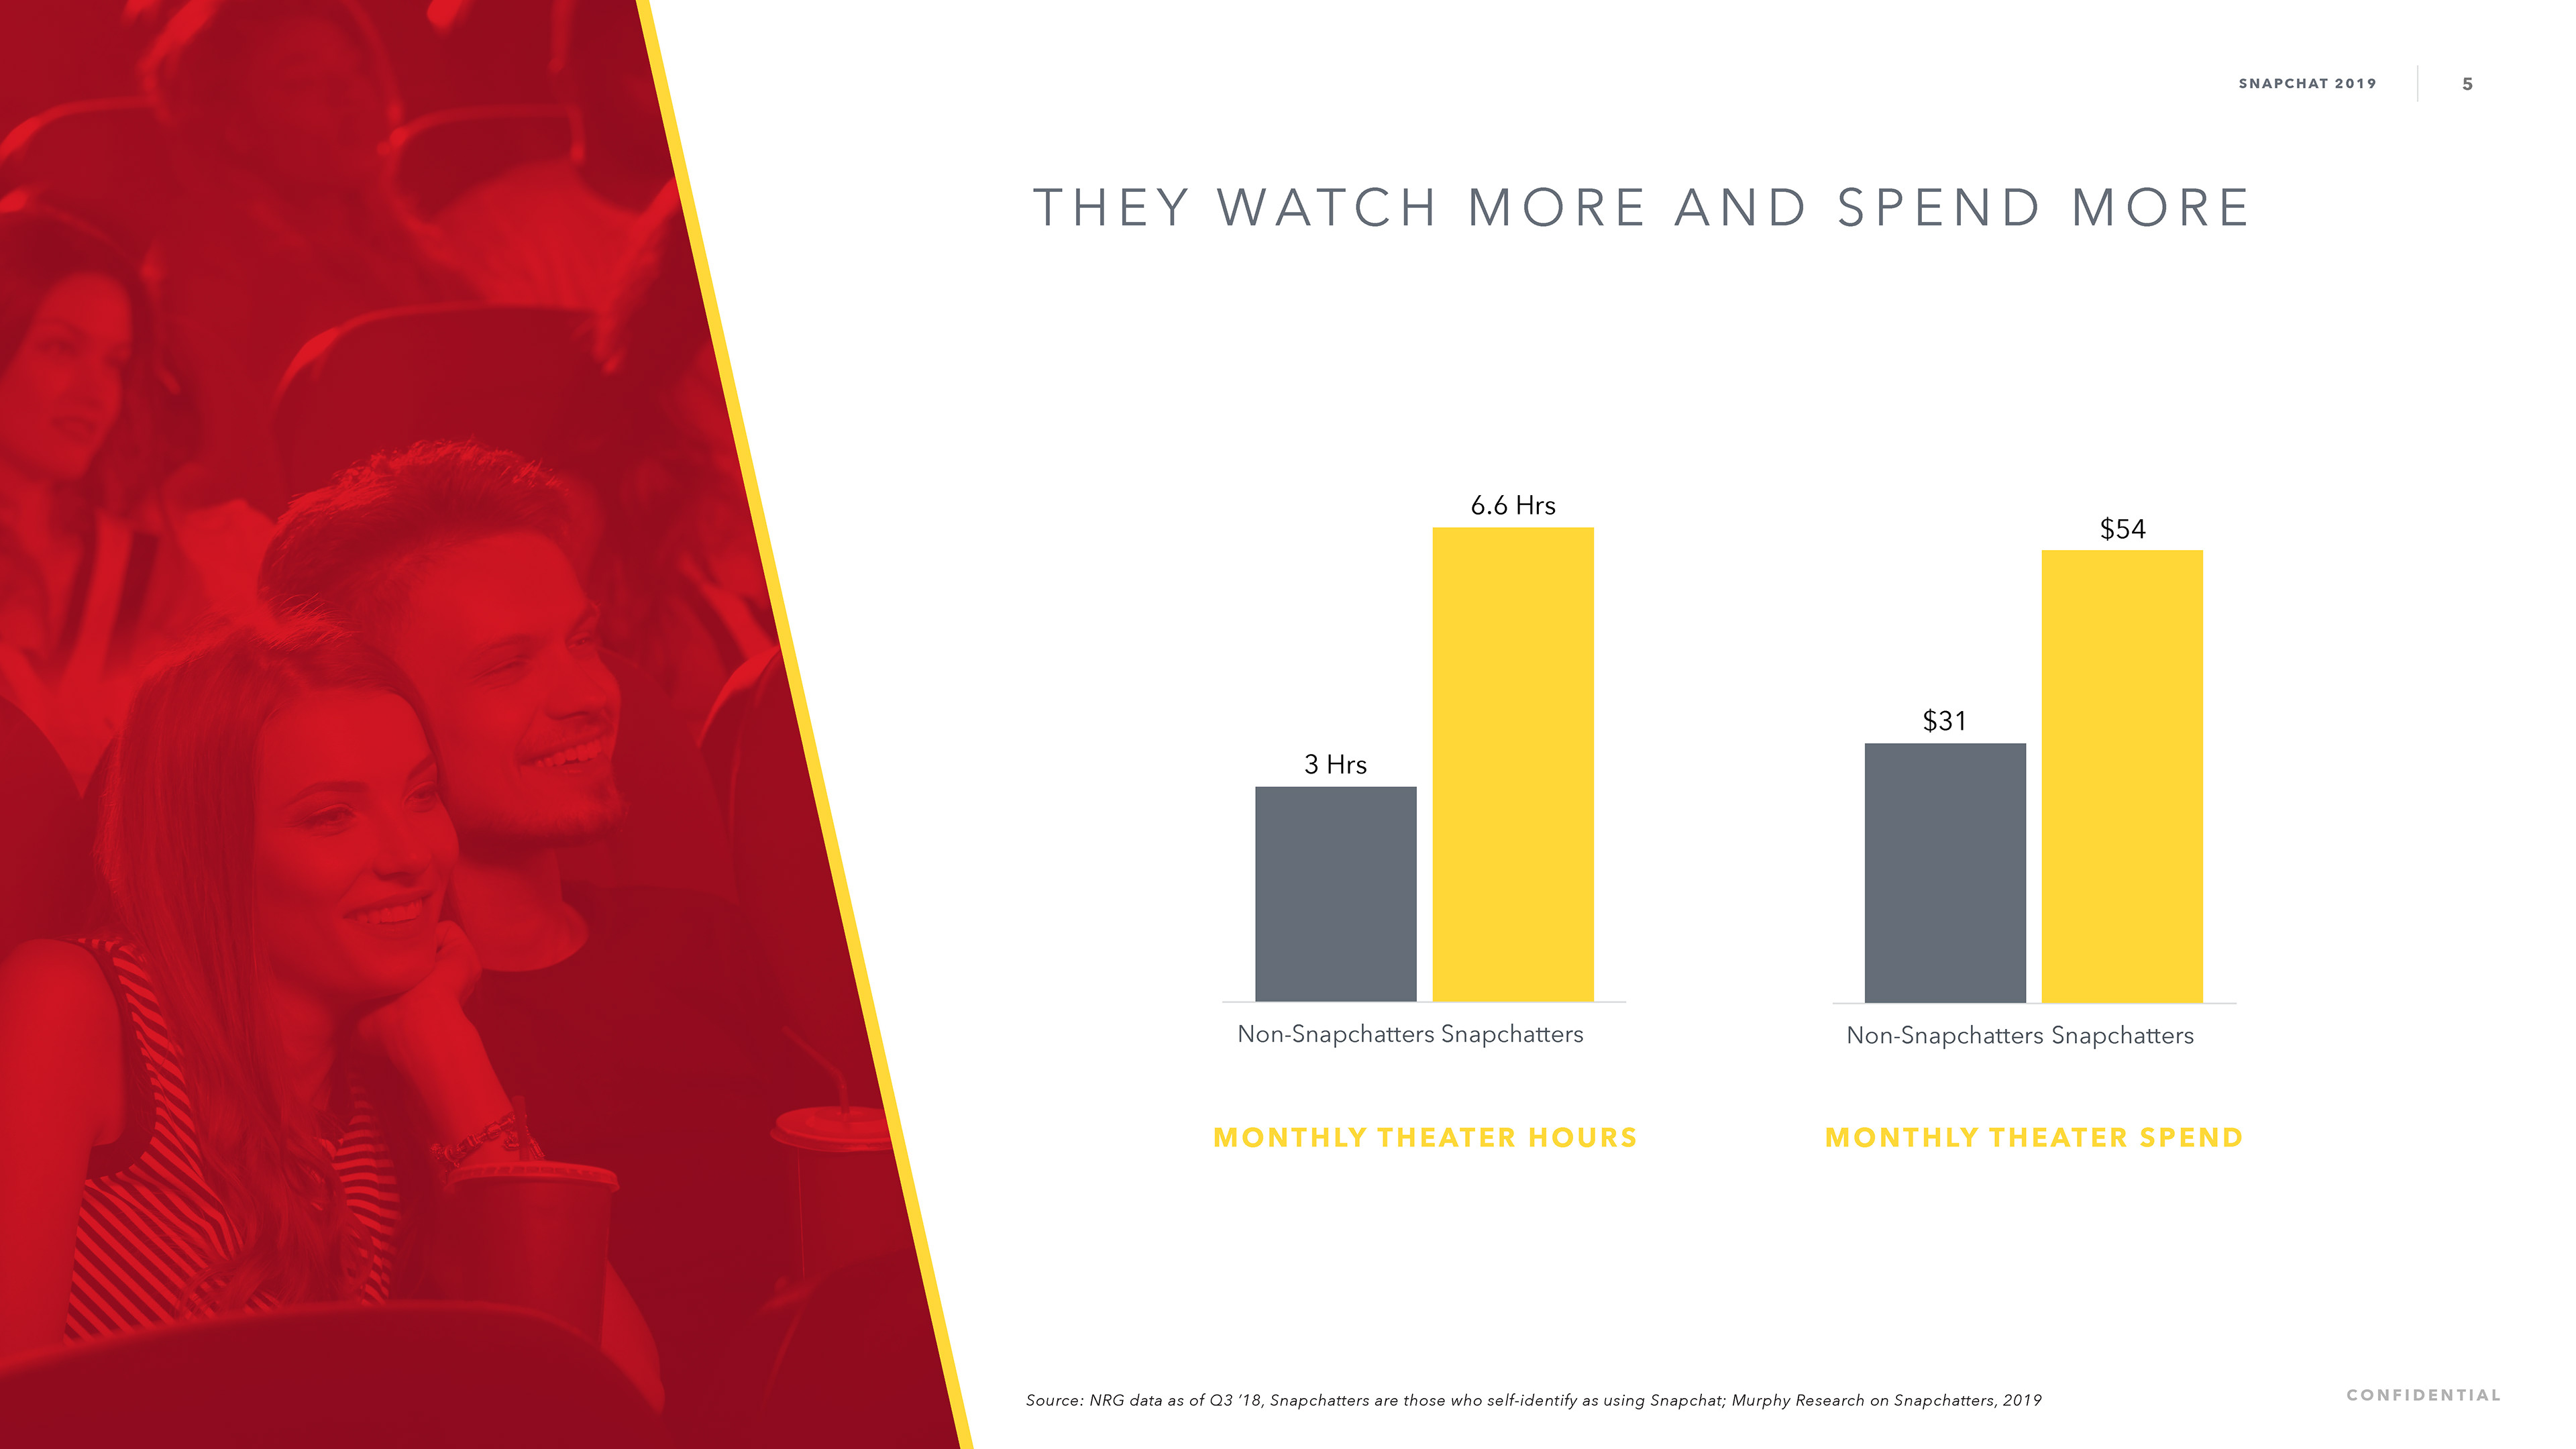
Develop a high-impact Corporate Narrative Presentation for Snap Inc. to communicate complex audience data and market projections to stakeholders. Working as a freelance designer at DDB, the objective was to create a “pitch-ready” deck that translates dense millennial and Gen-Z consumer analytics into a compelling, visually-driven brand story.
STRATEGY
I utilized a dark-mode aesthetic with a vibrant, neon-gradient color palette to ensure the data visualization stood out against a sophisticated, textured black background. By focusing on dynamic infographics—including tiered bar charts, area graphs, and comparative platform metrics—I transformed abstract statistics into clear, actionable insights. Every slide was designed to maintain a high-tech, futuristic feel that aligns with Snapchat’s innovative identity, using a clean typographic hierarchy to make the “at-a-glance” takeaways immediate and undeniable.
CLIENT


SNAPCHAT BUSINESS TO BUSINESS
ONE SHEETS
ONE SHEETS
LAYOUT, TYPOGRAPHY AND DATA VISUALIZATION
Project DATE | 2018
BRIEF
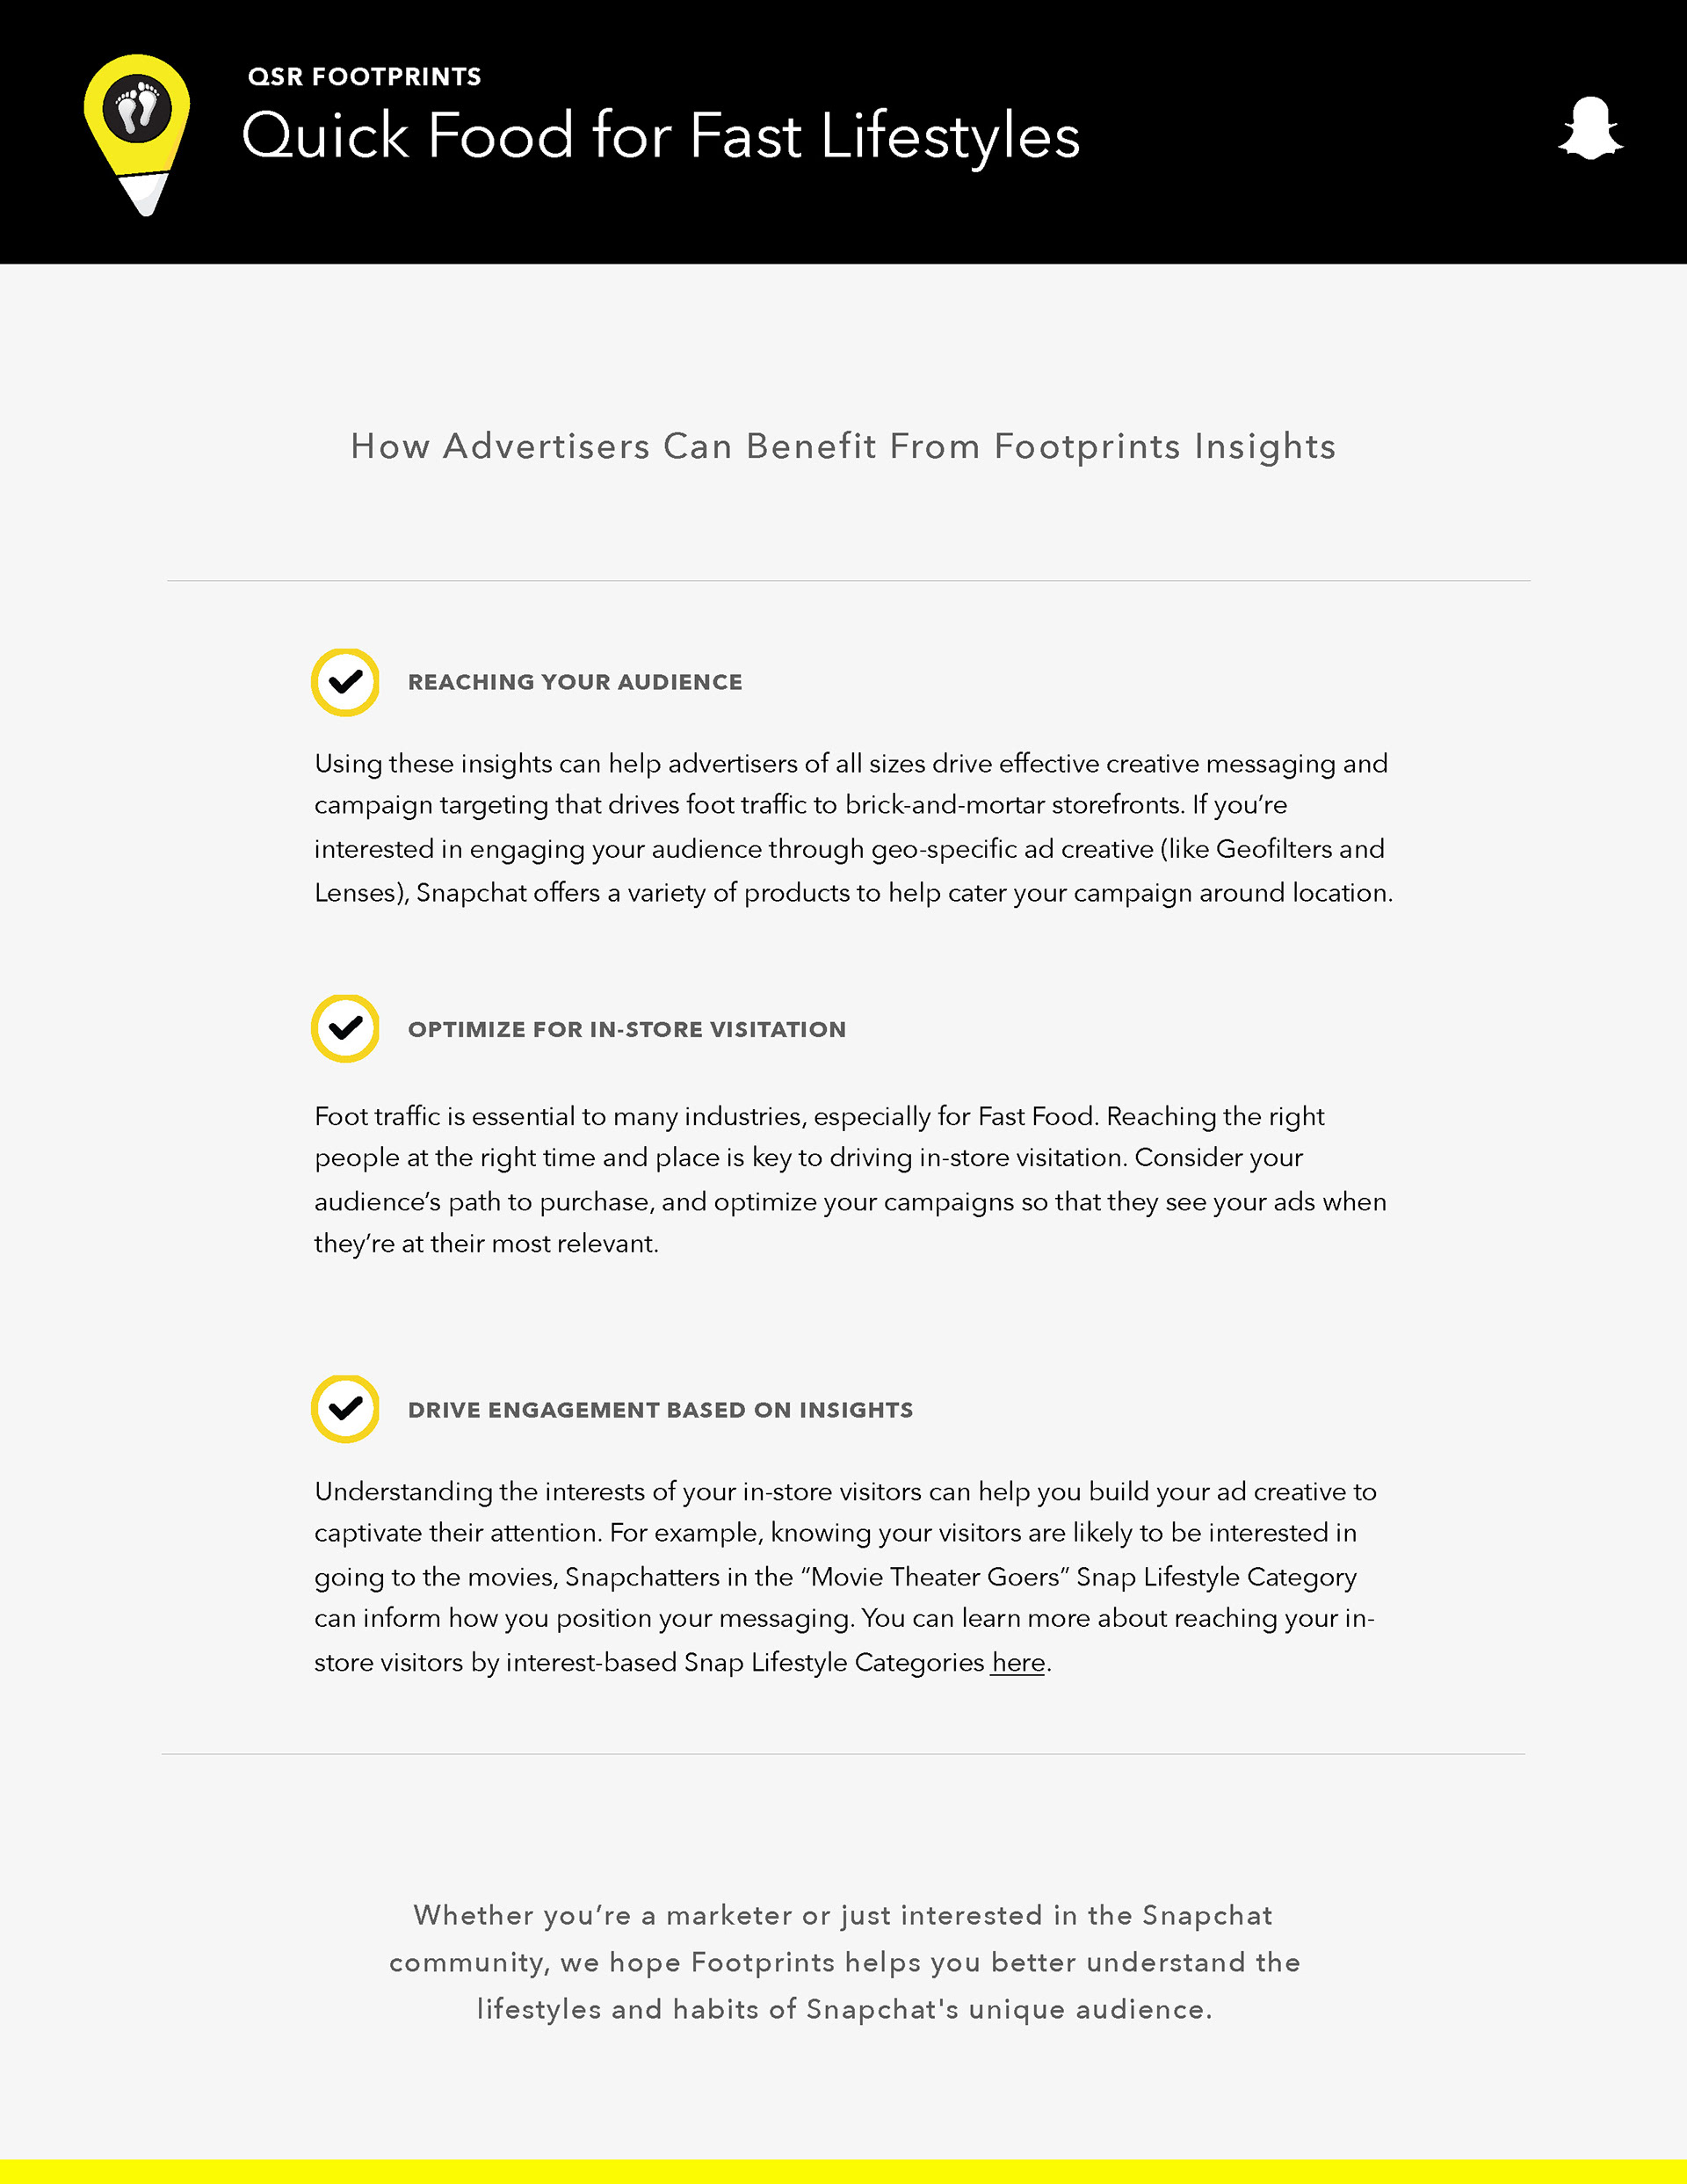
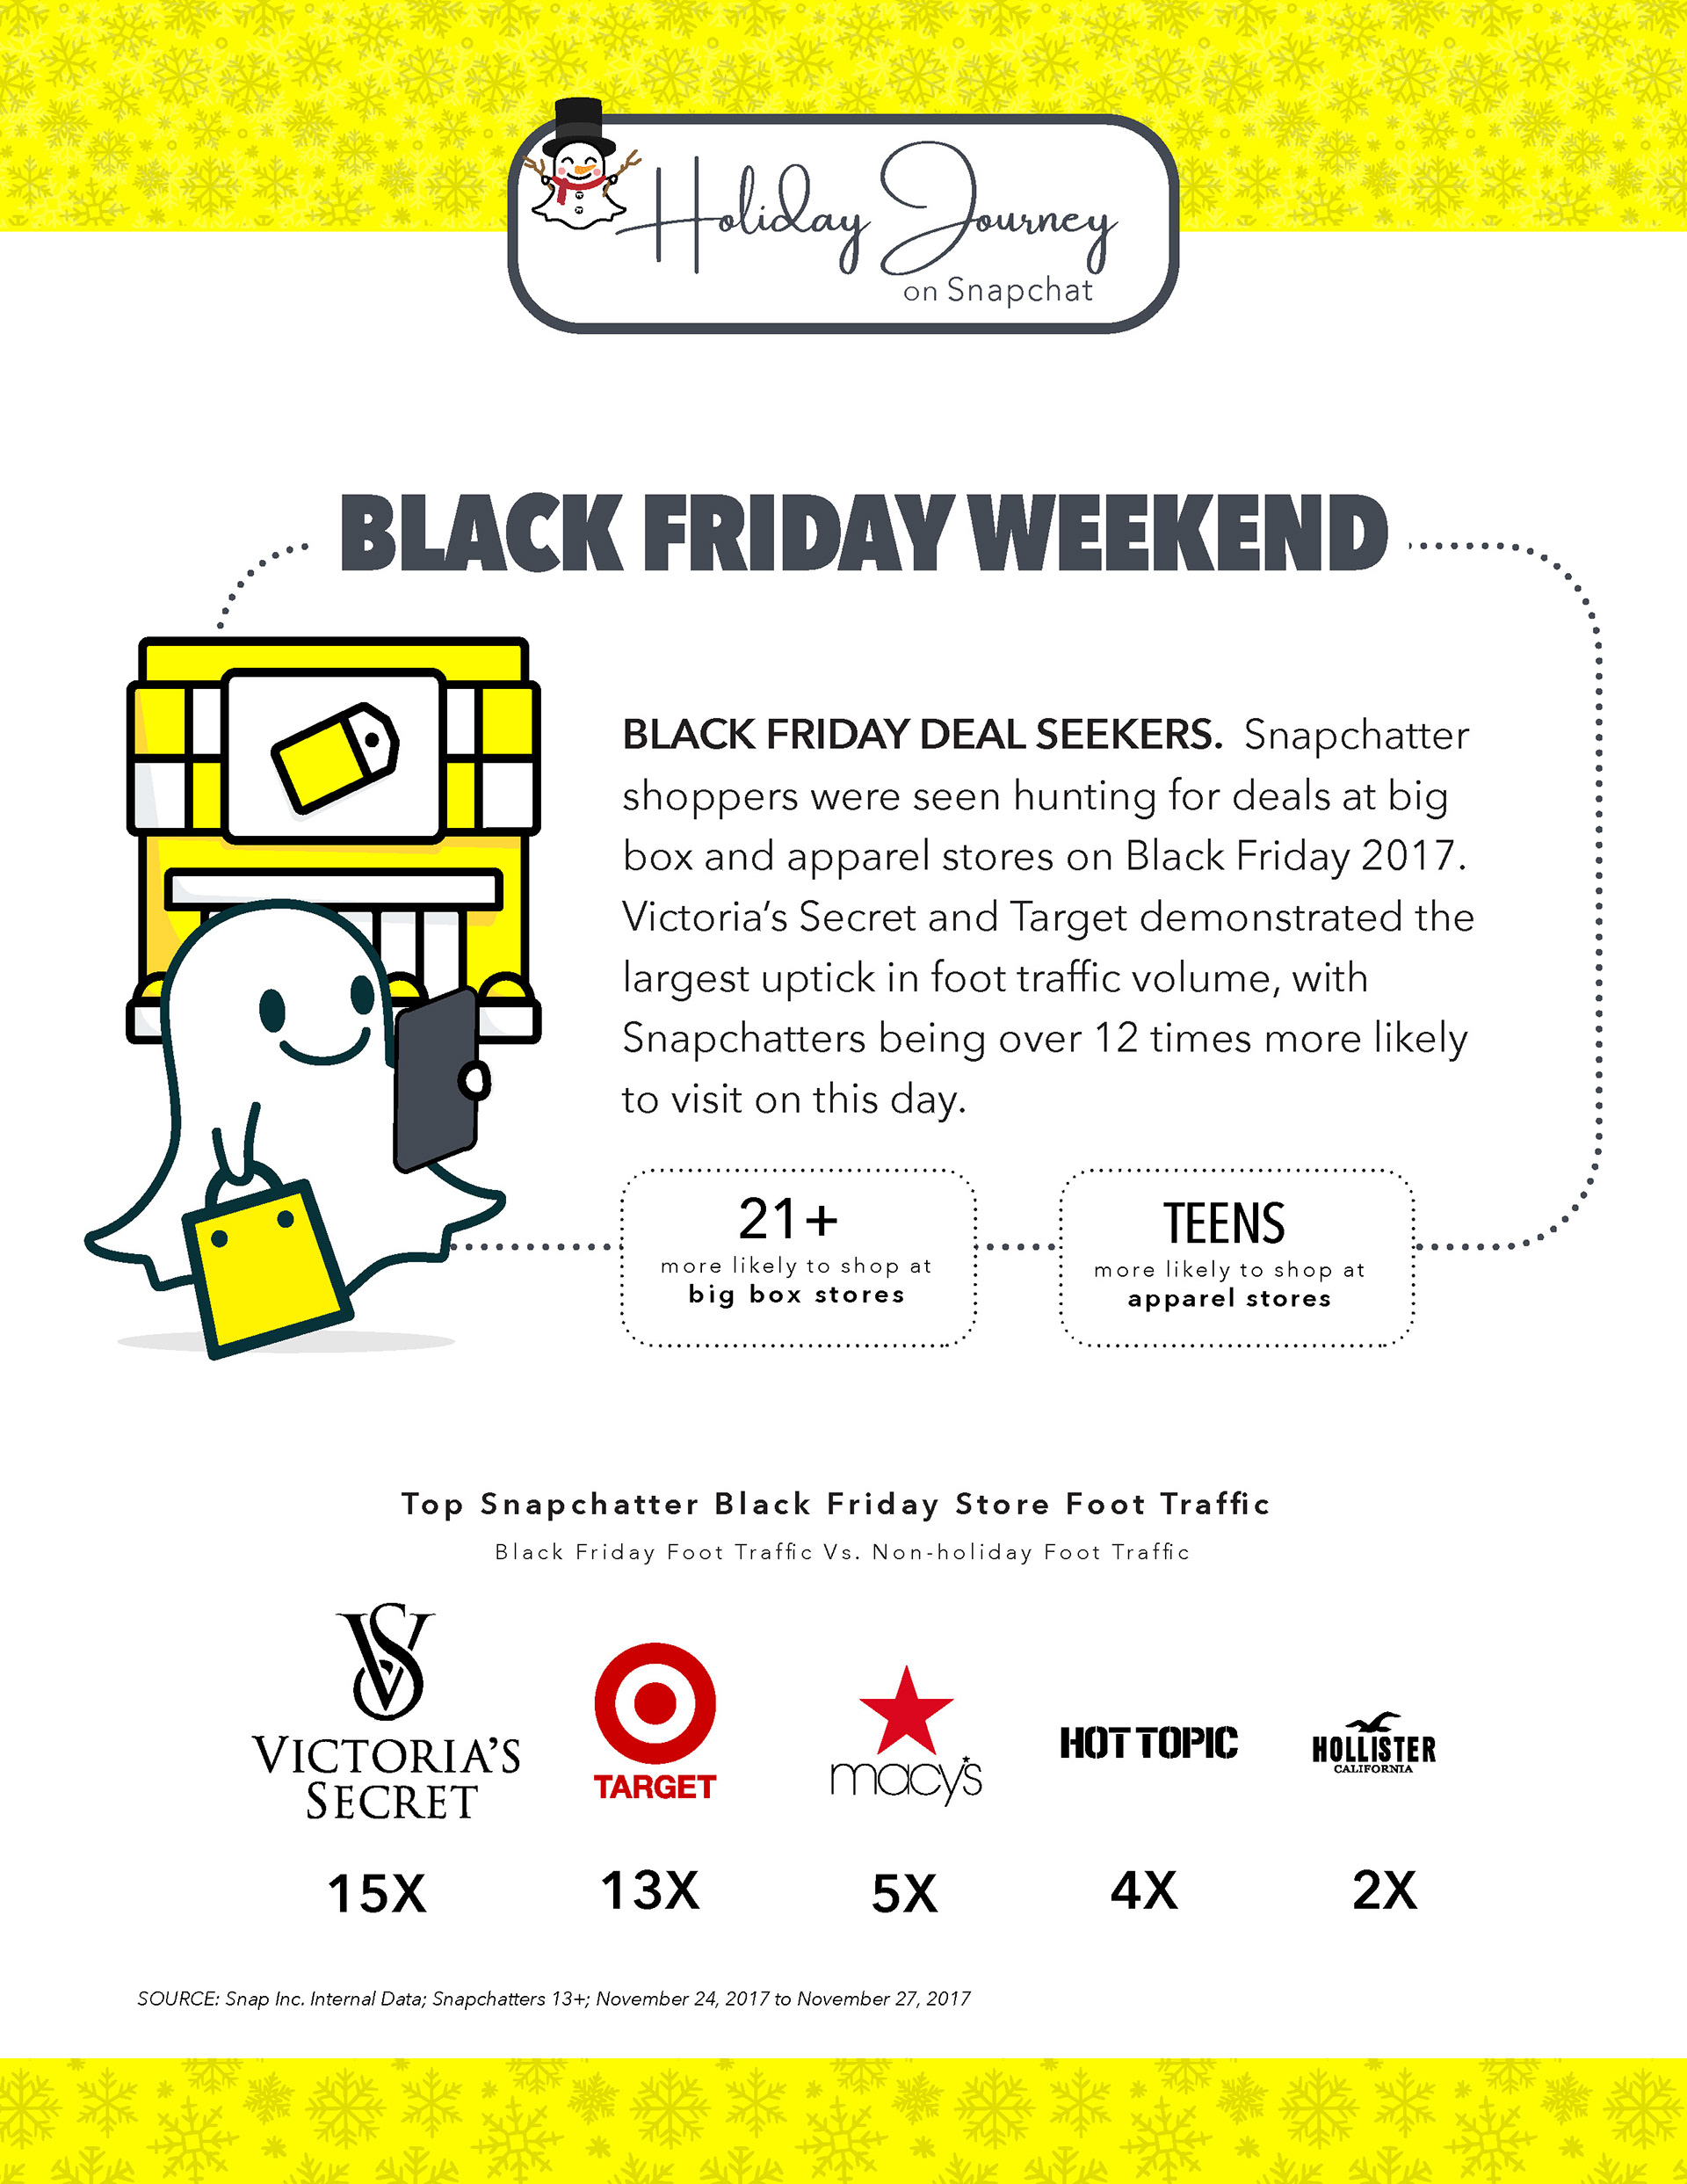
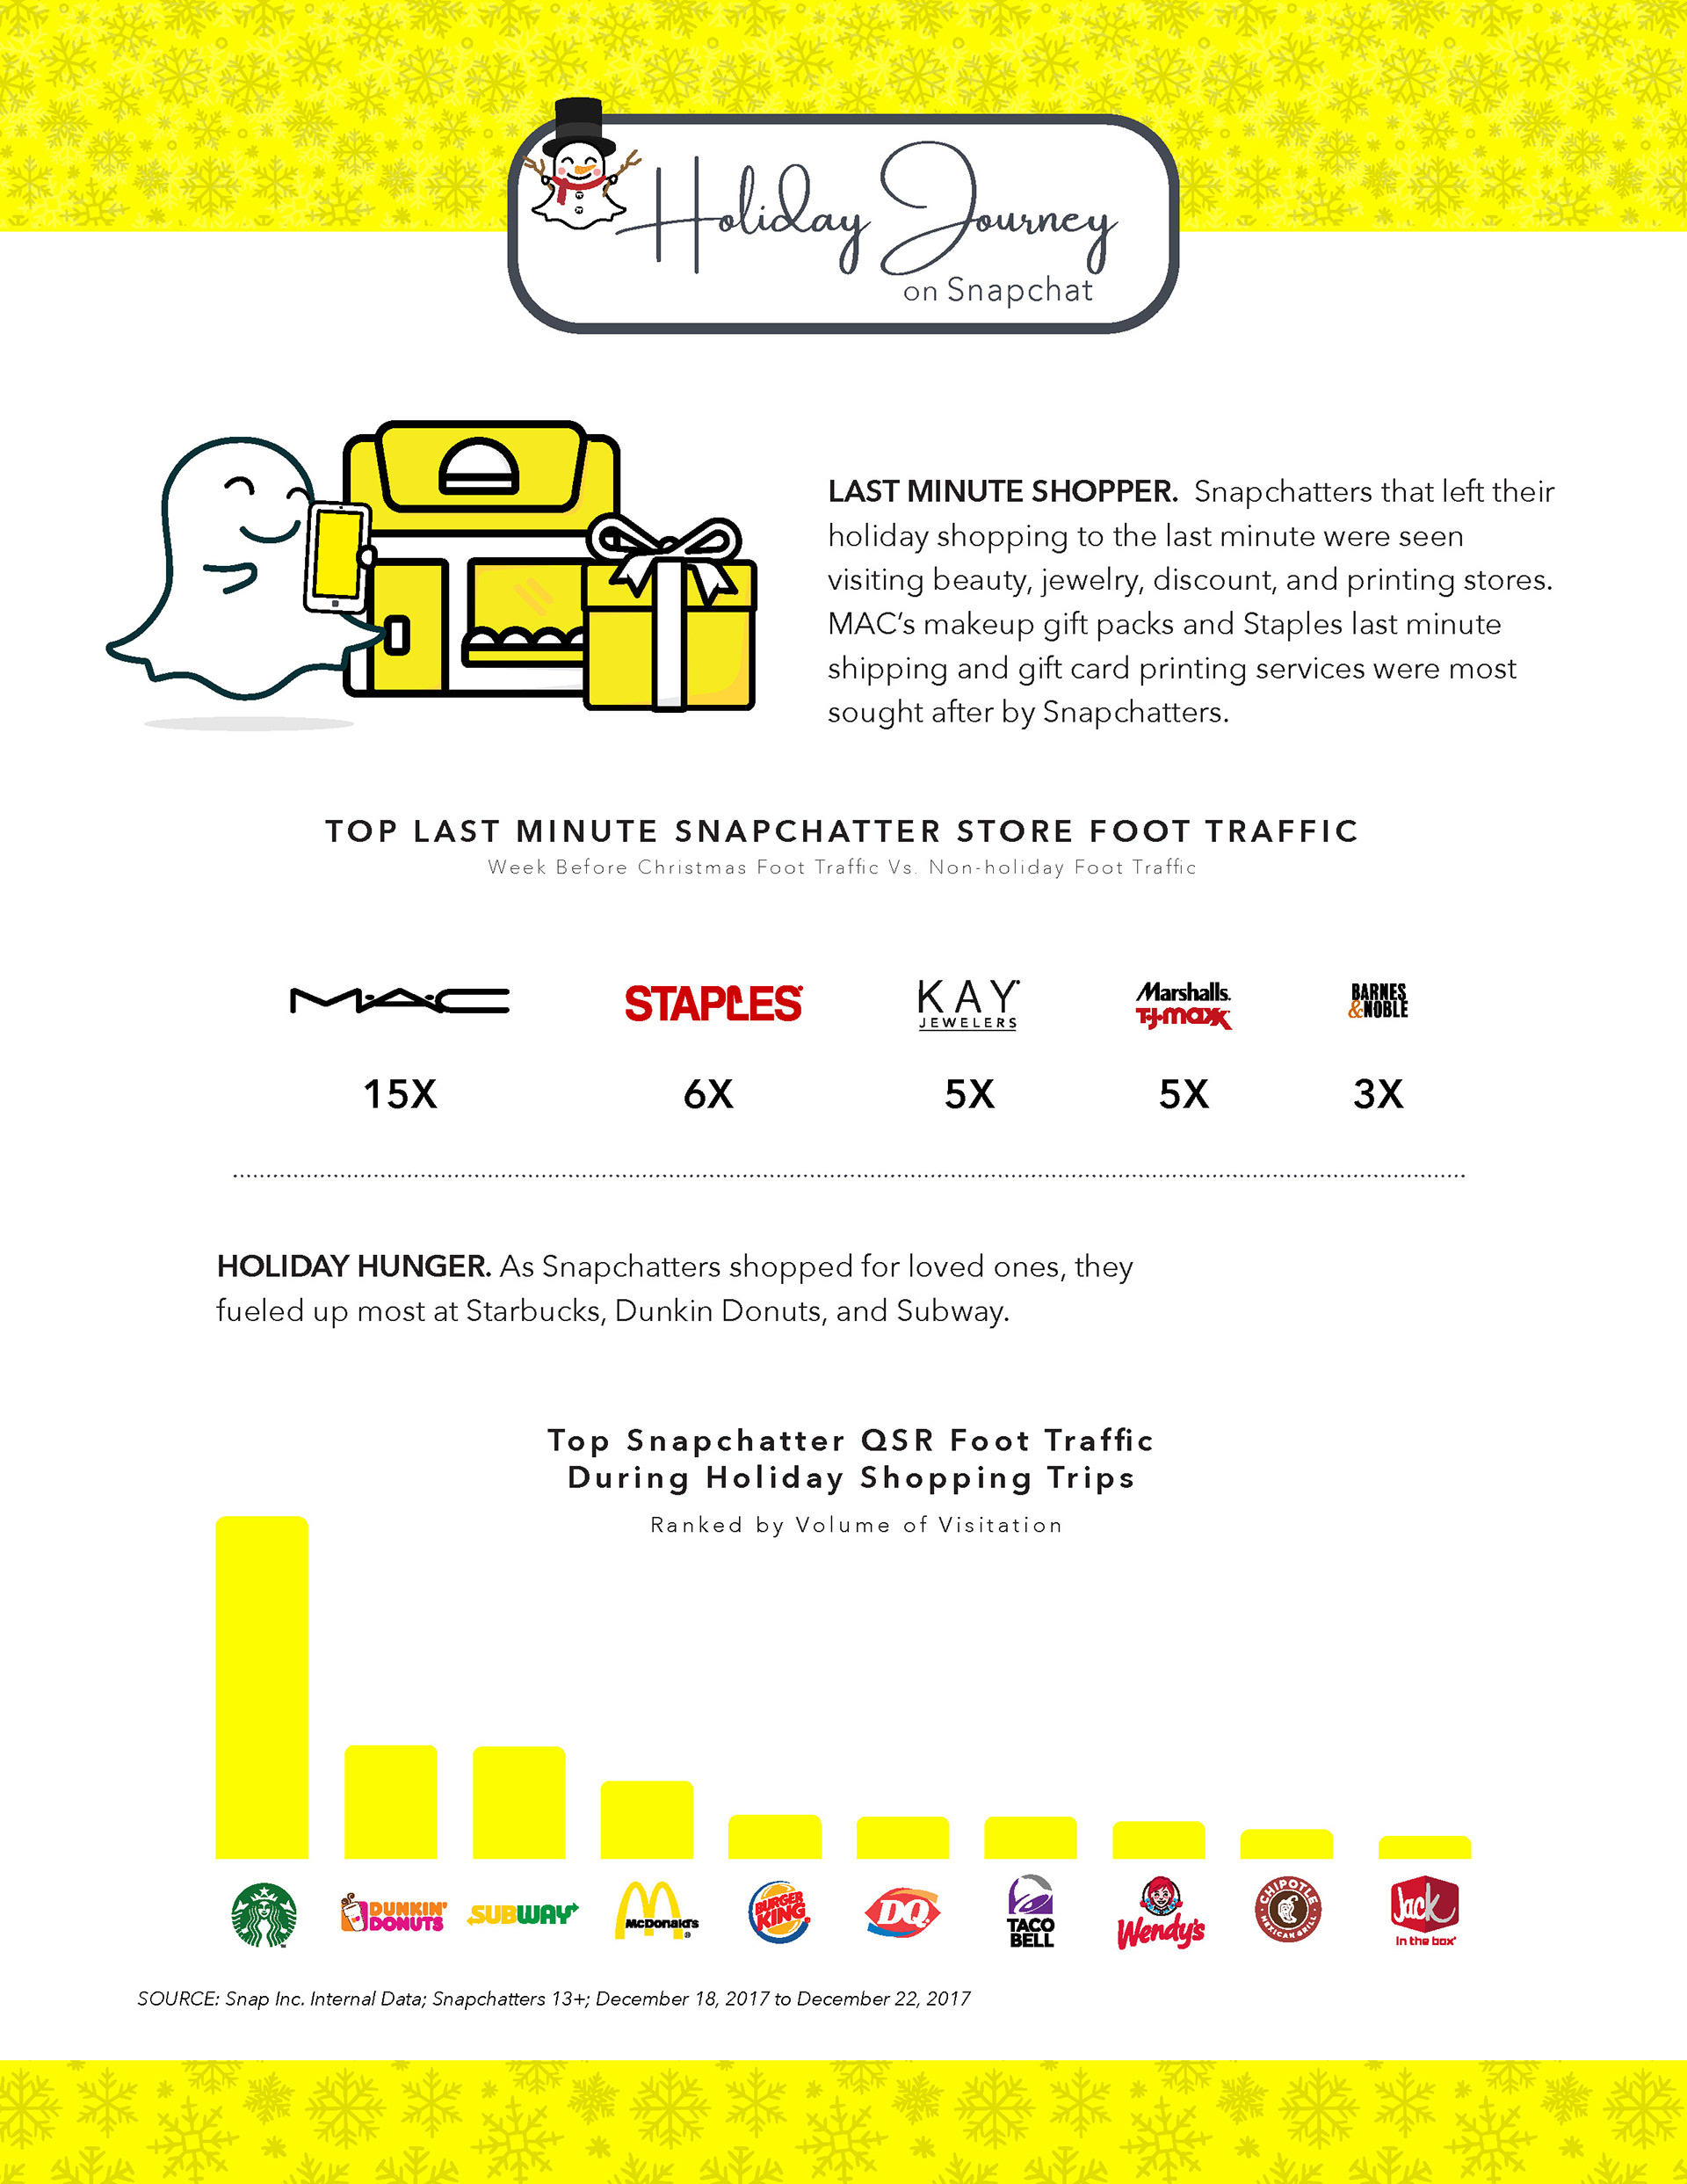
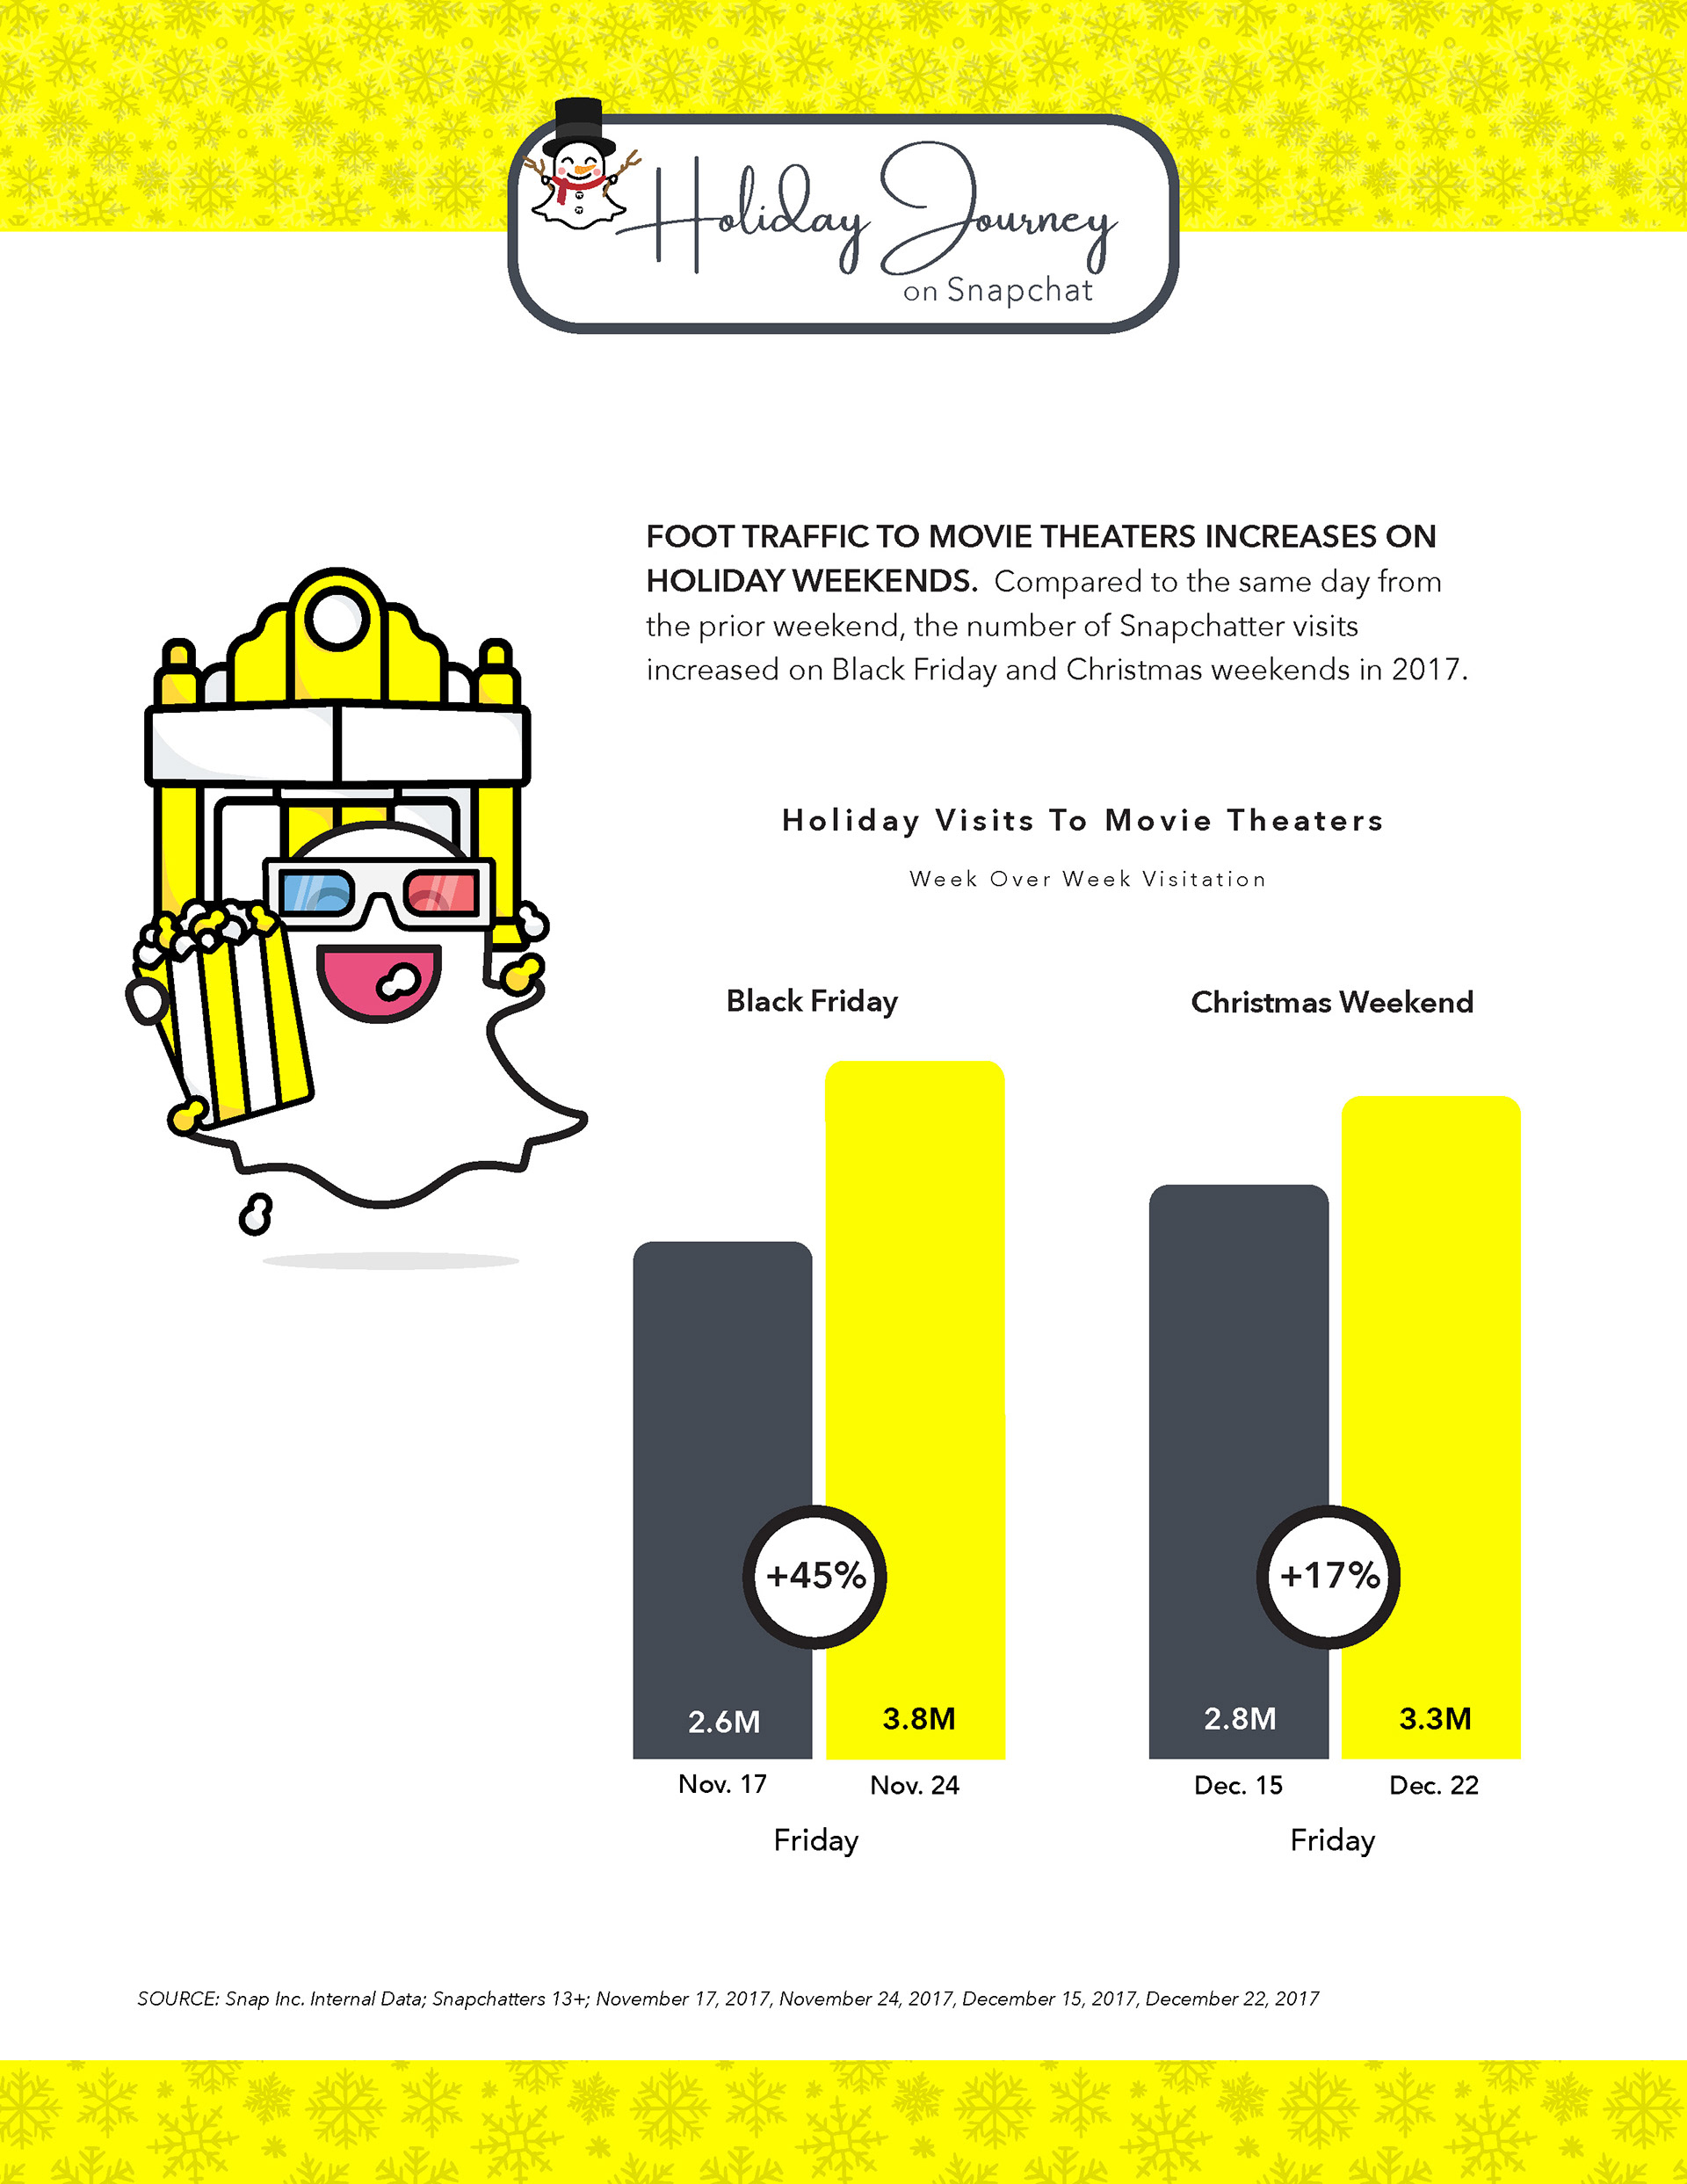
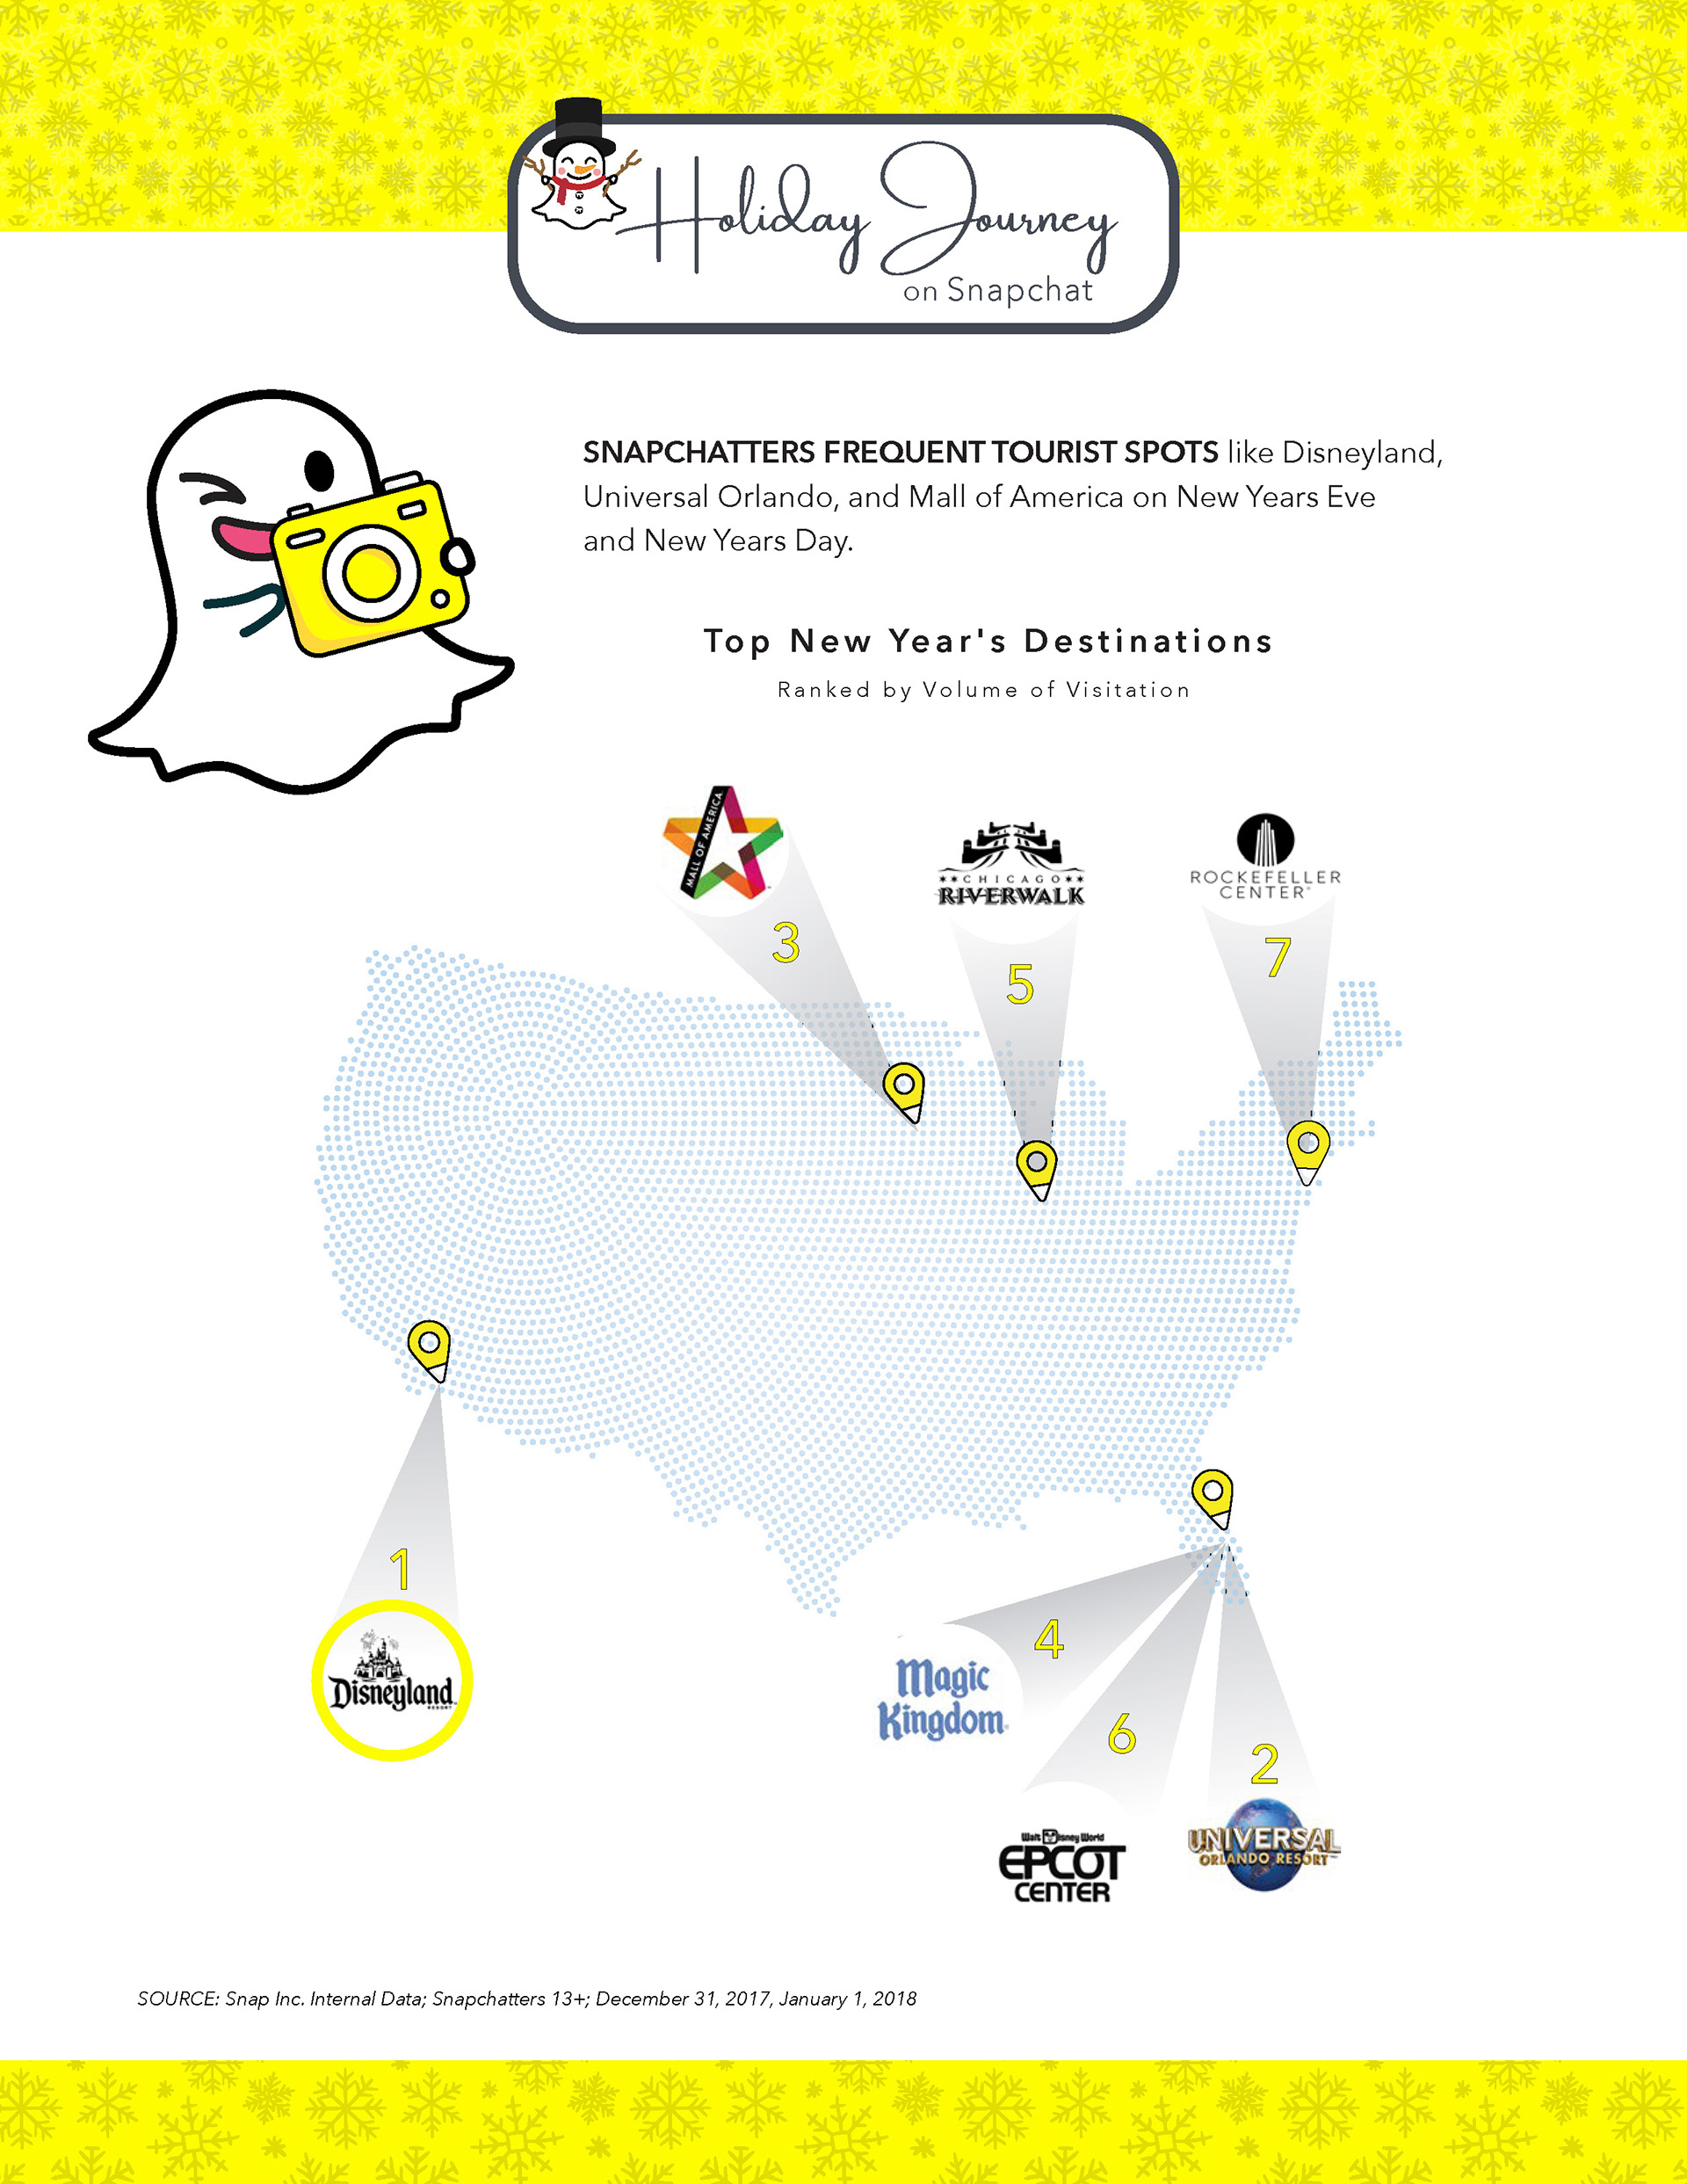
Create a series of B2B marketing one-sheets to communicate Snapchat’s massive advertising reach and audience insights to potential brand partners. The project required transforming complex behavioral data and holiday performance metrics into high-impact, easy-to-digest visual summaries that empower the sales team and drive advertiser investment.
STRATEGY
I leveraged a data-first design approach, using bold typography and custom iconography to highlight key performance indicators, such as the 850M views during Black Friday. By maintaining the brand’s signature minimalist yellow and white aesthetic, I ensured the materials felt authentically “Snap,” while using structured grids to keep technical information professional and legible.

CLIENT


SNAPCHAT BLOG POST
DATA VISUALIZATION
DATA VISUALIZATION
LAYOUT, TYPOGRAPHY AND DATA VISUALIZATION
Project DATE | 2018
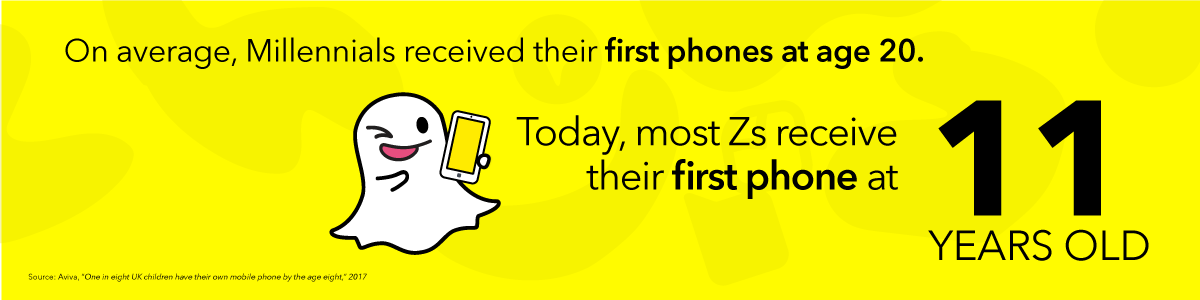
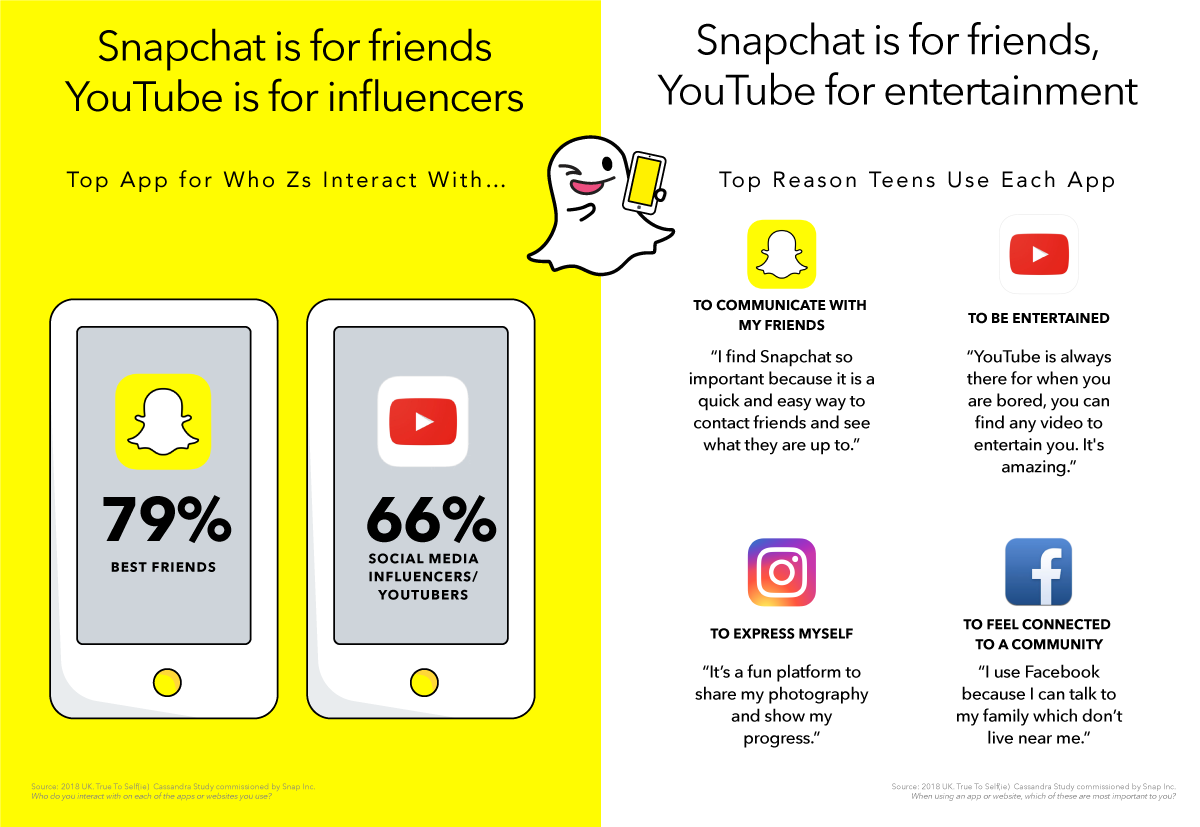
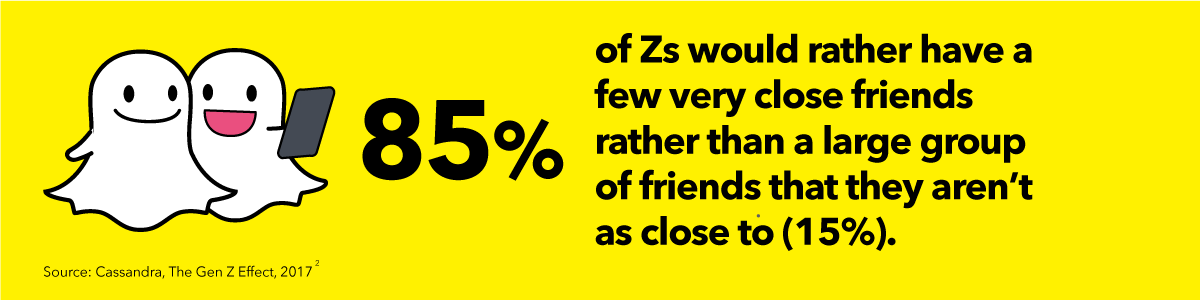
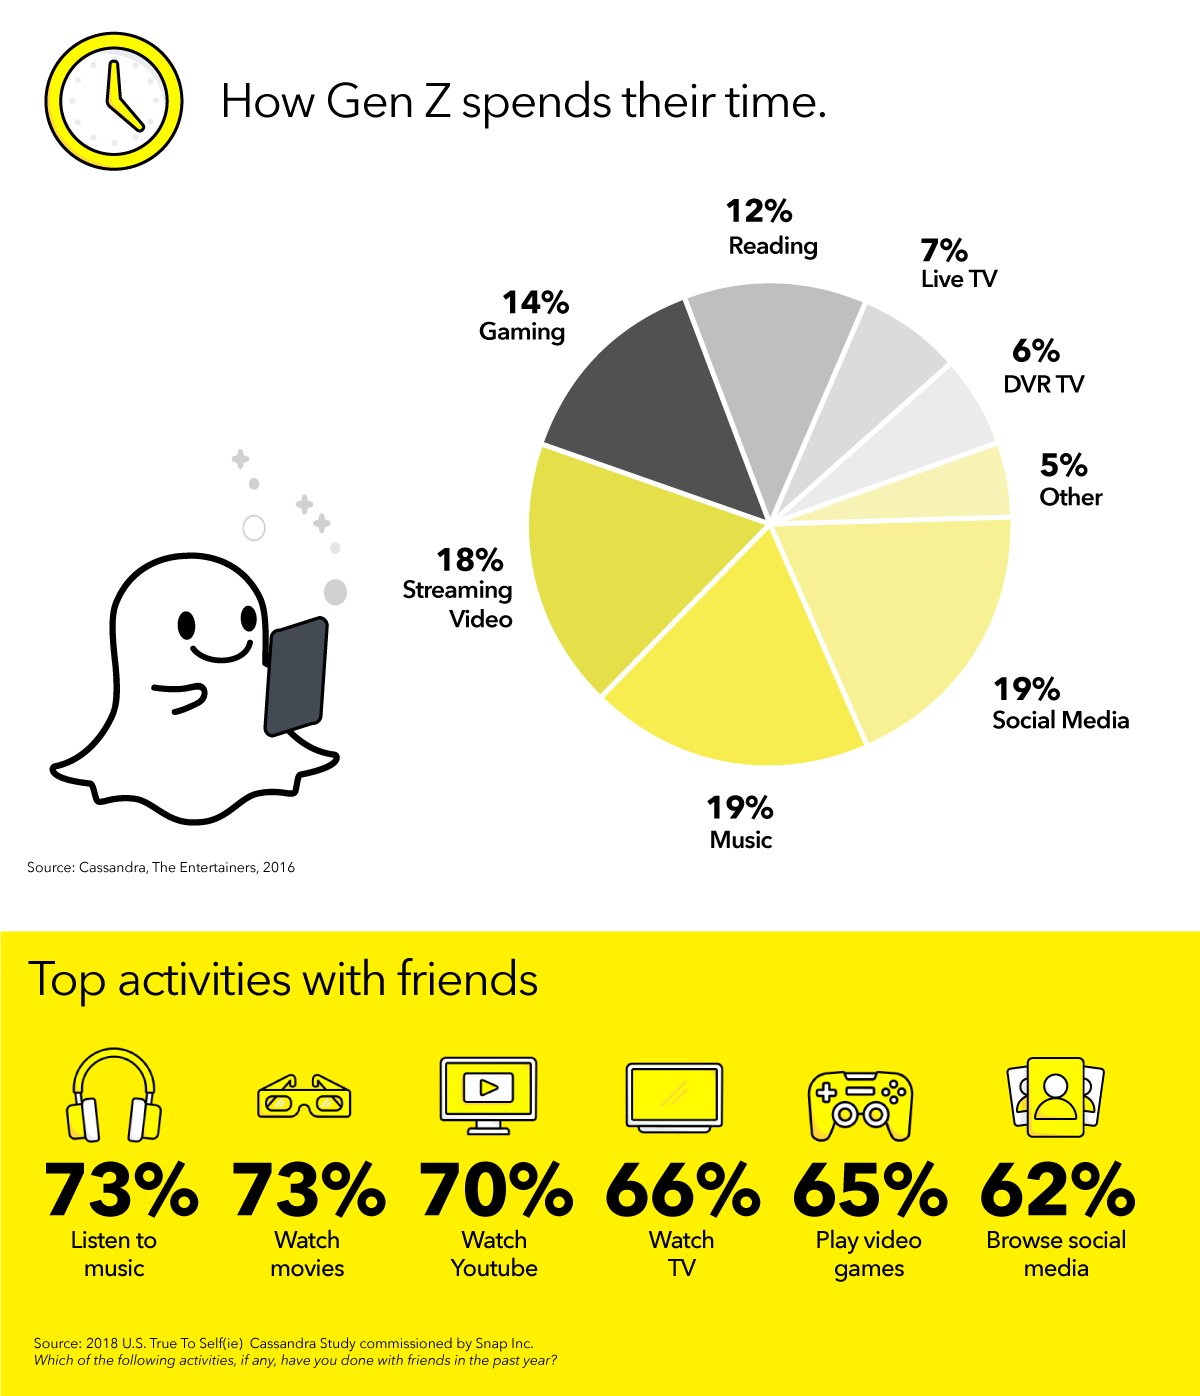
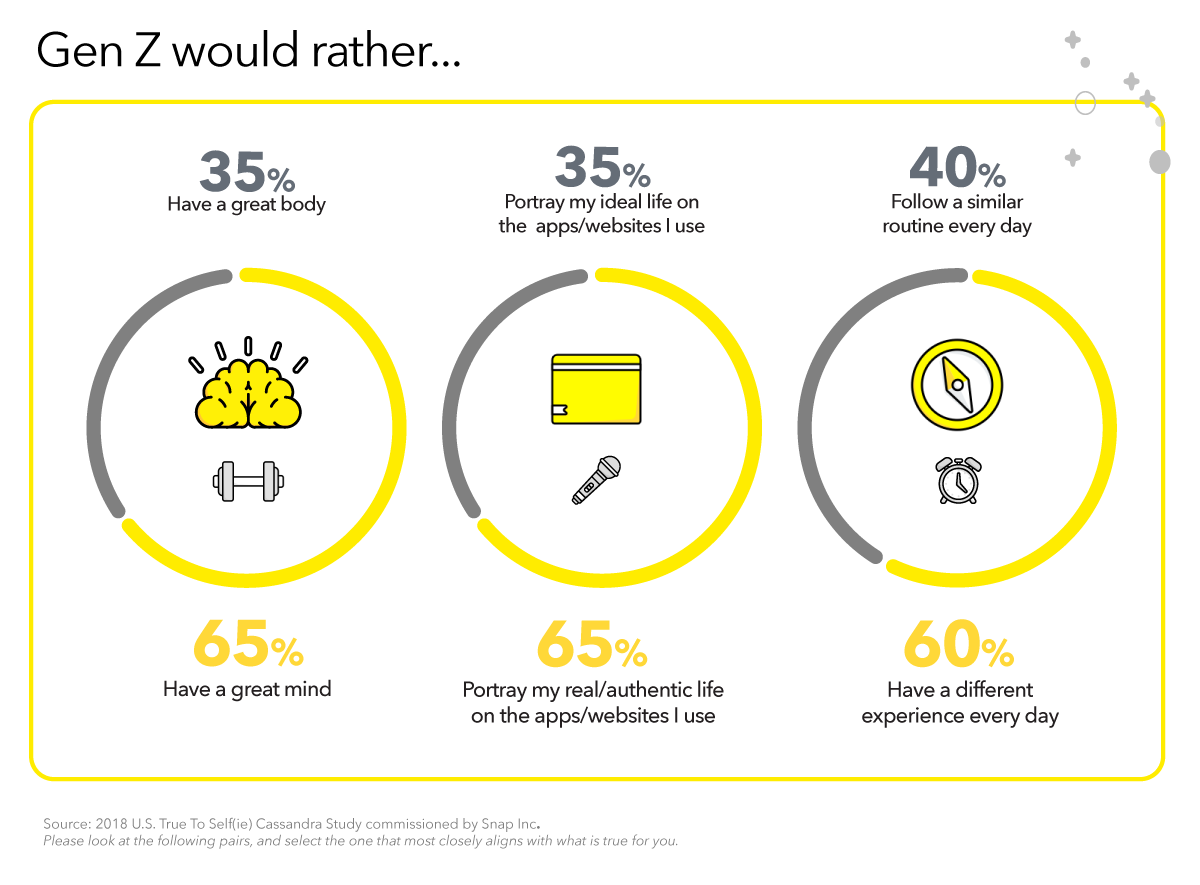
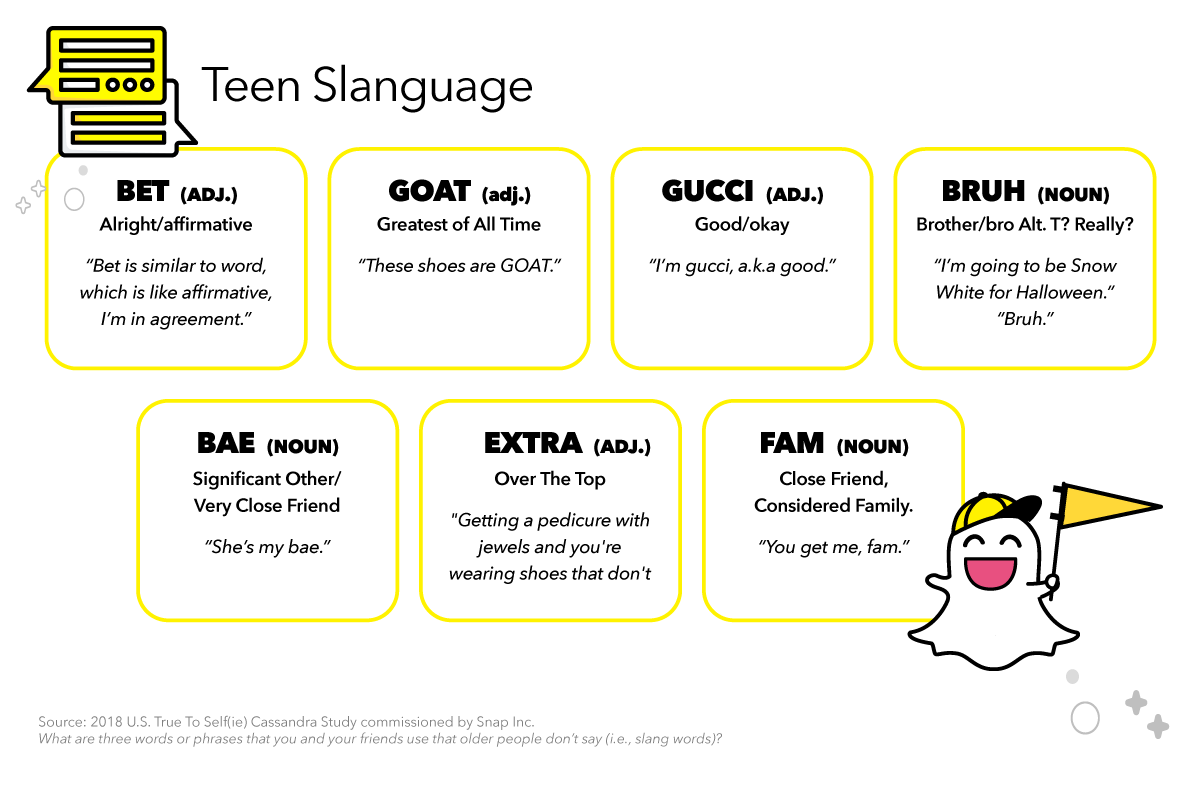
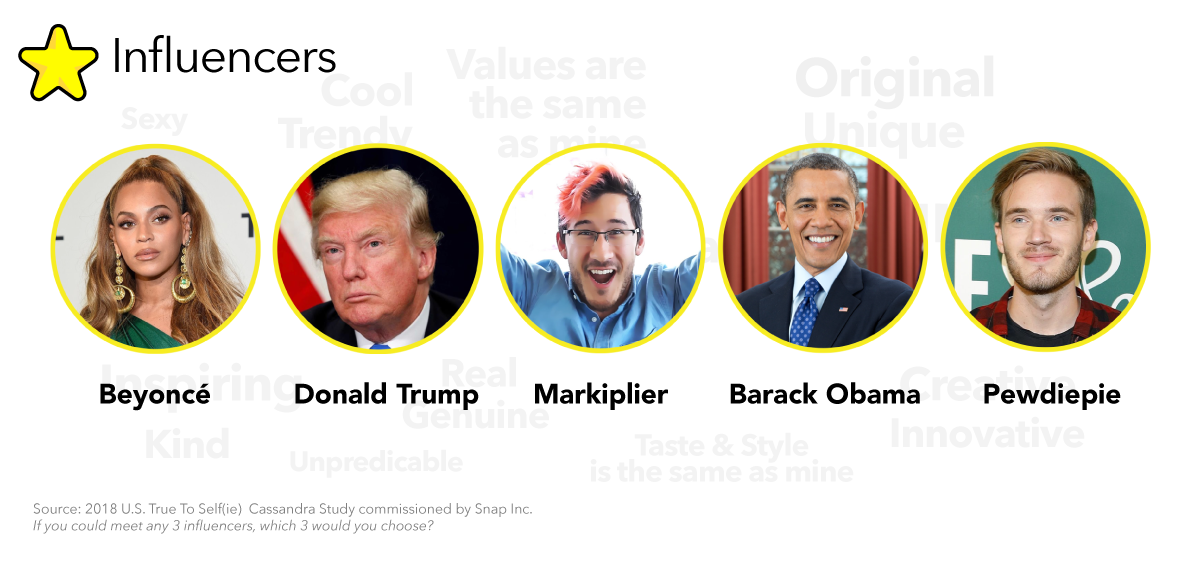
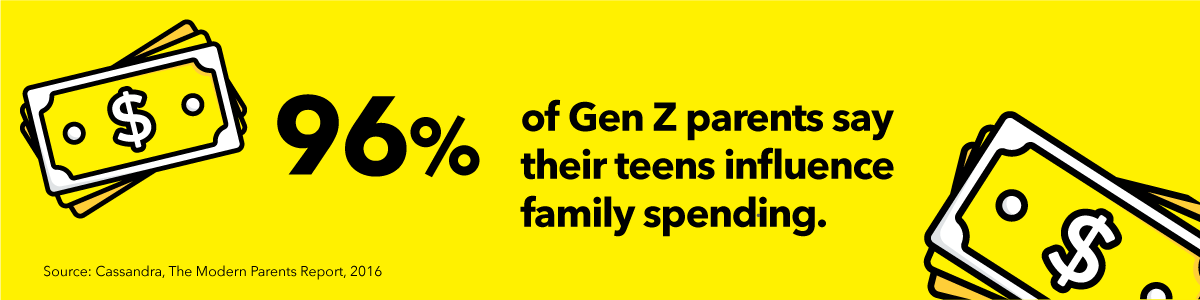
BRIEF
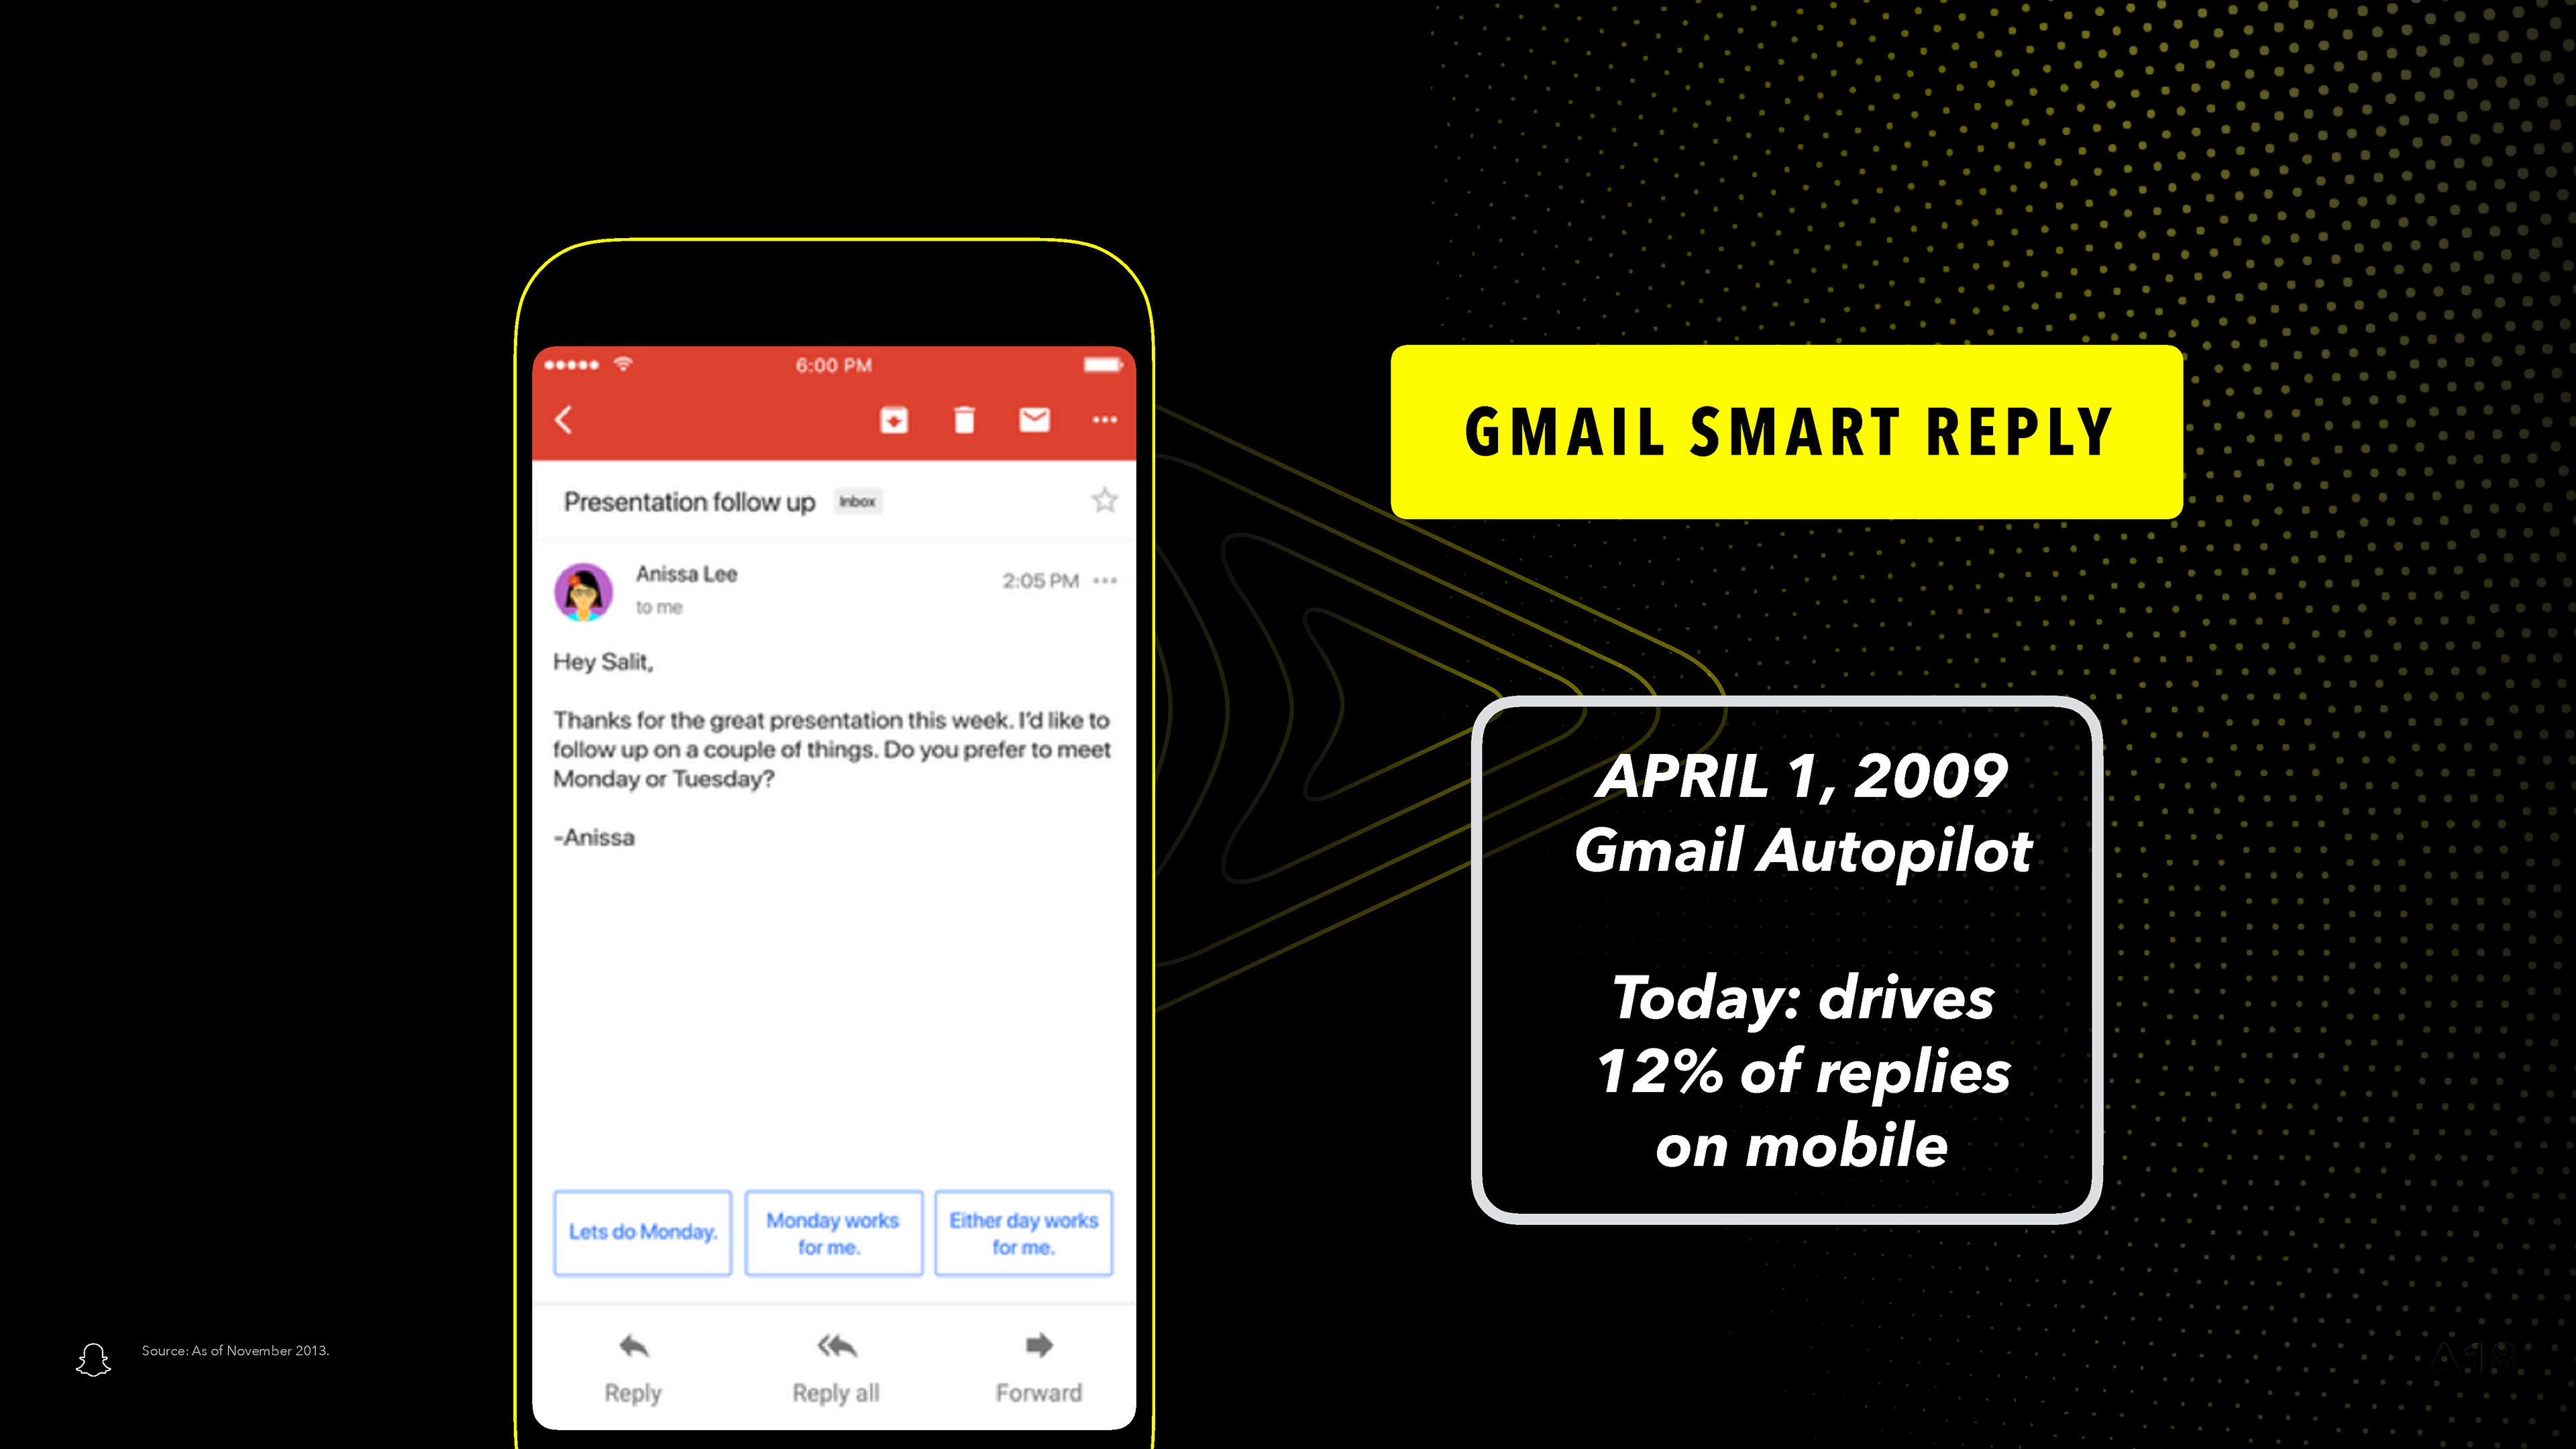
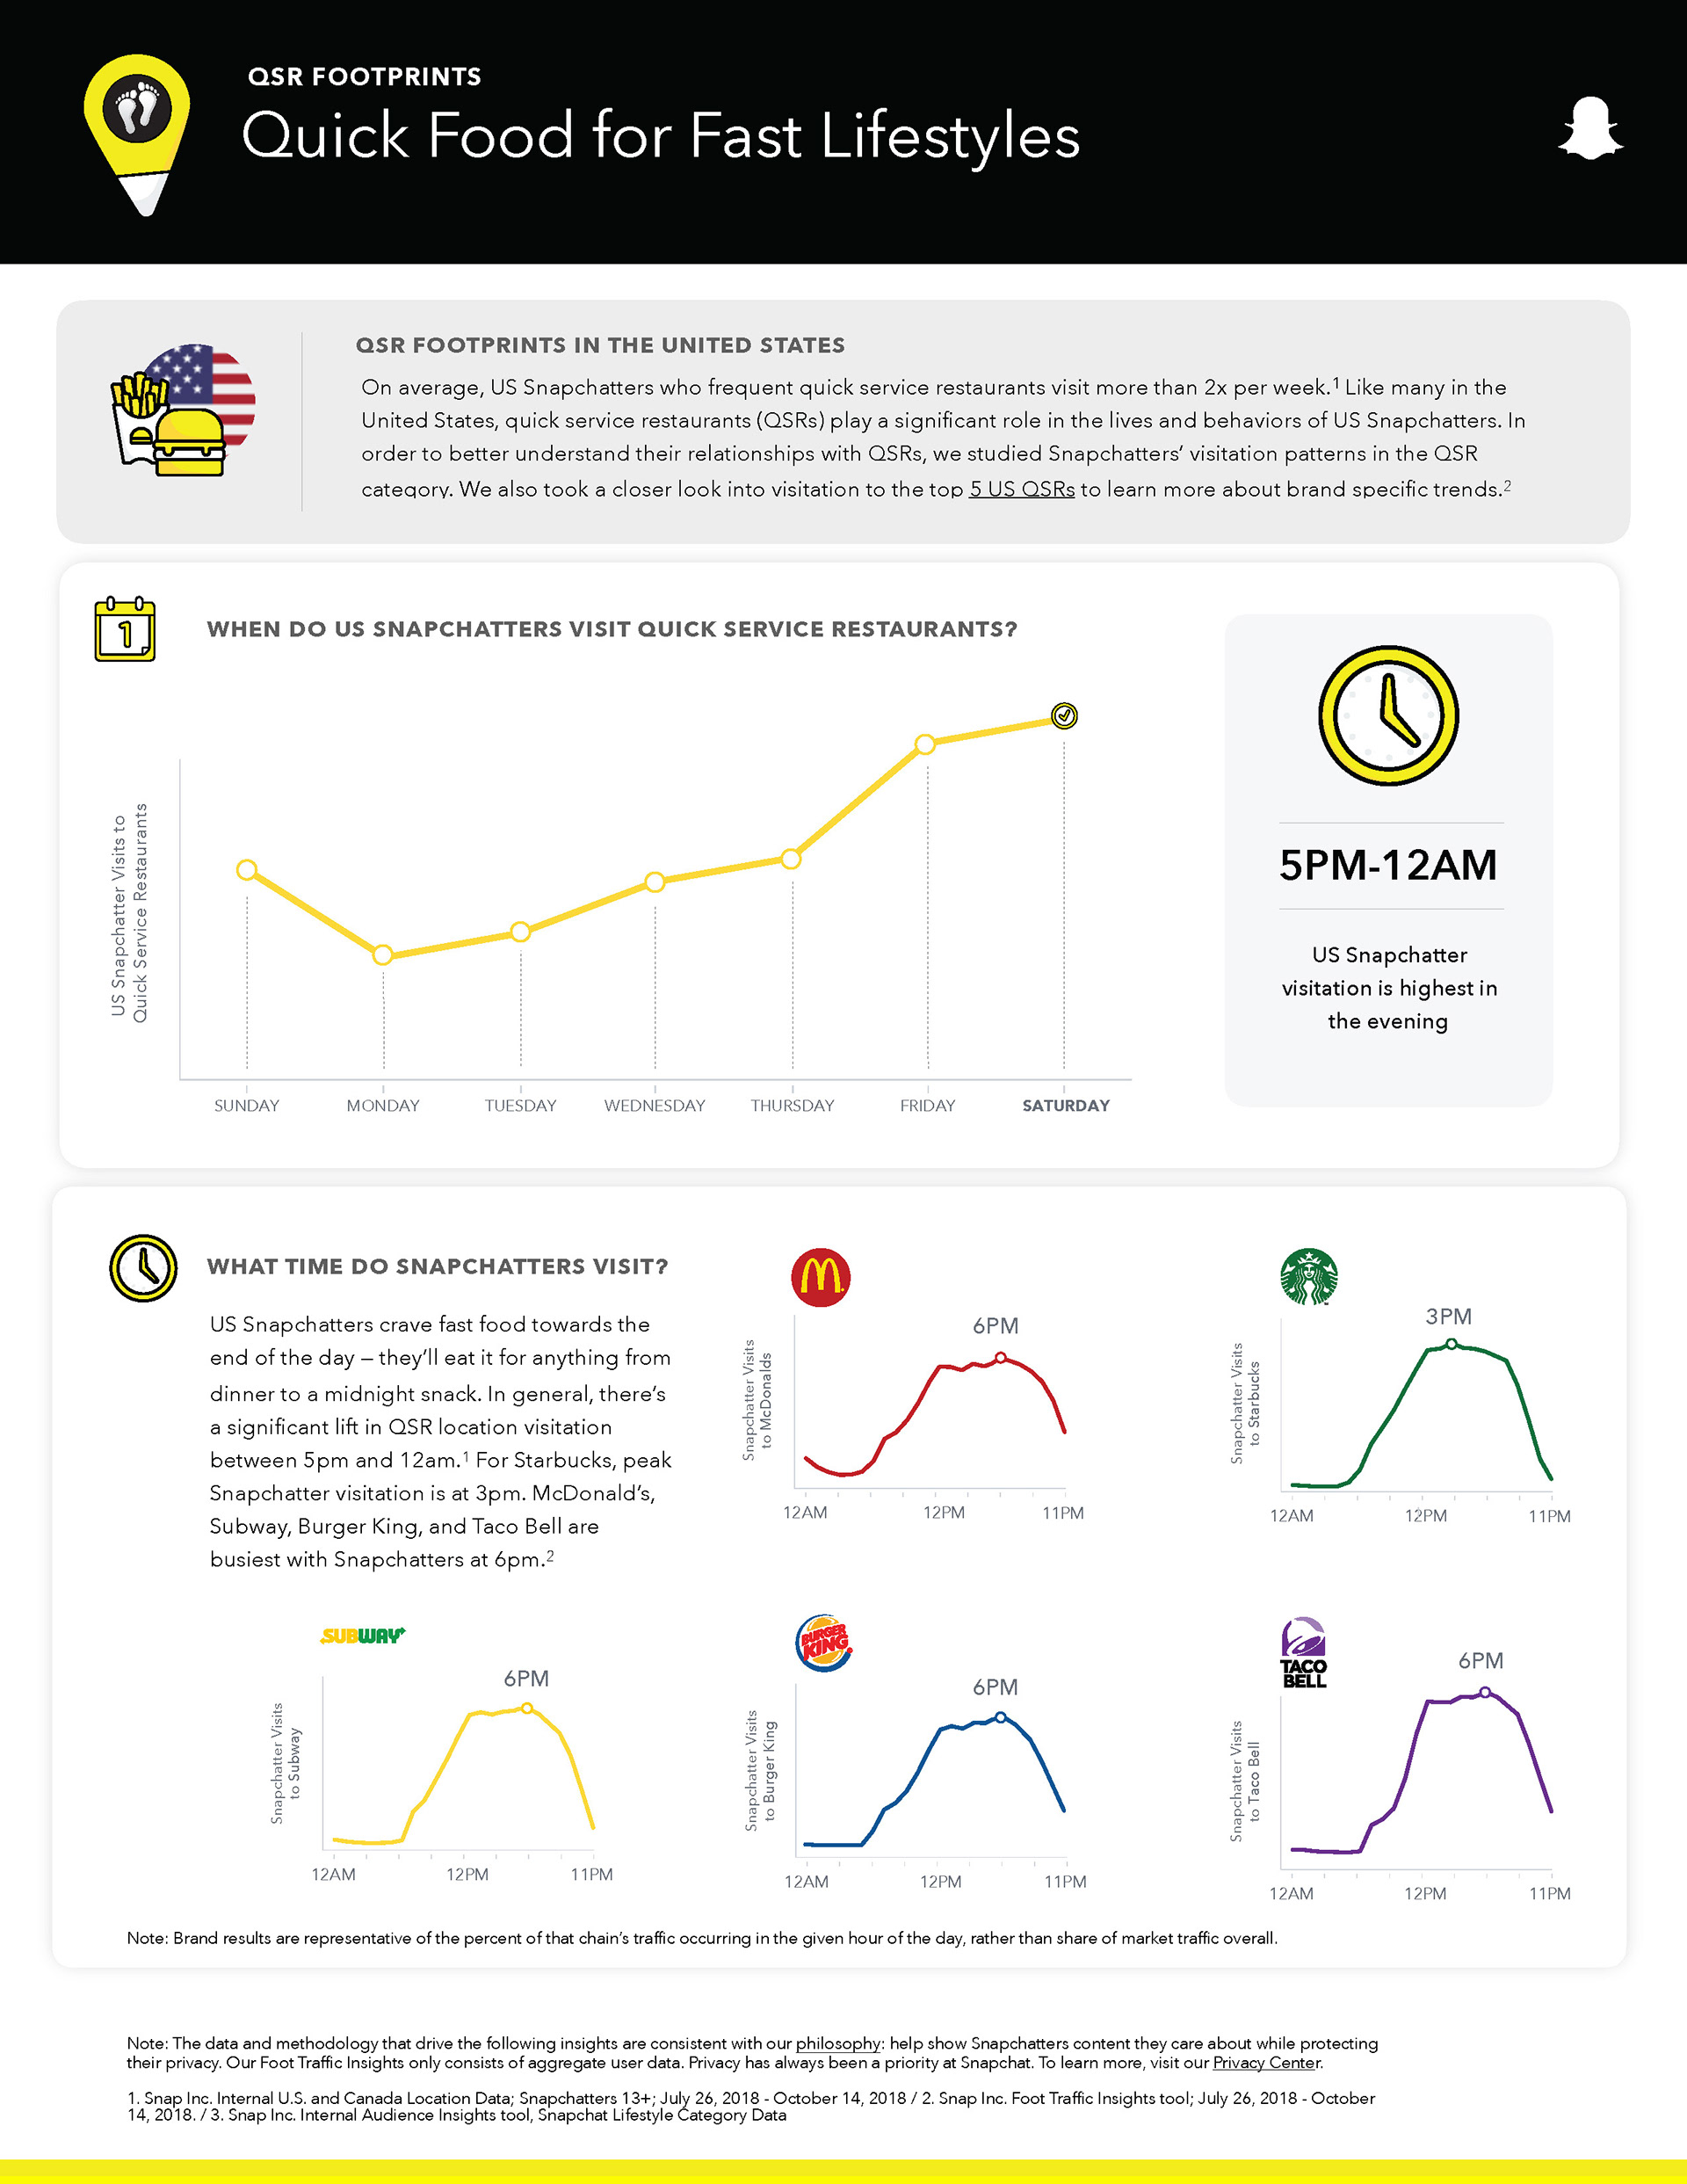
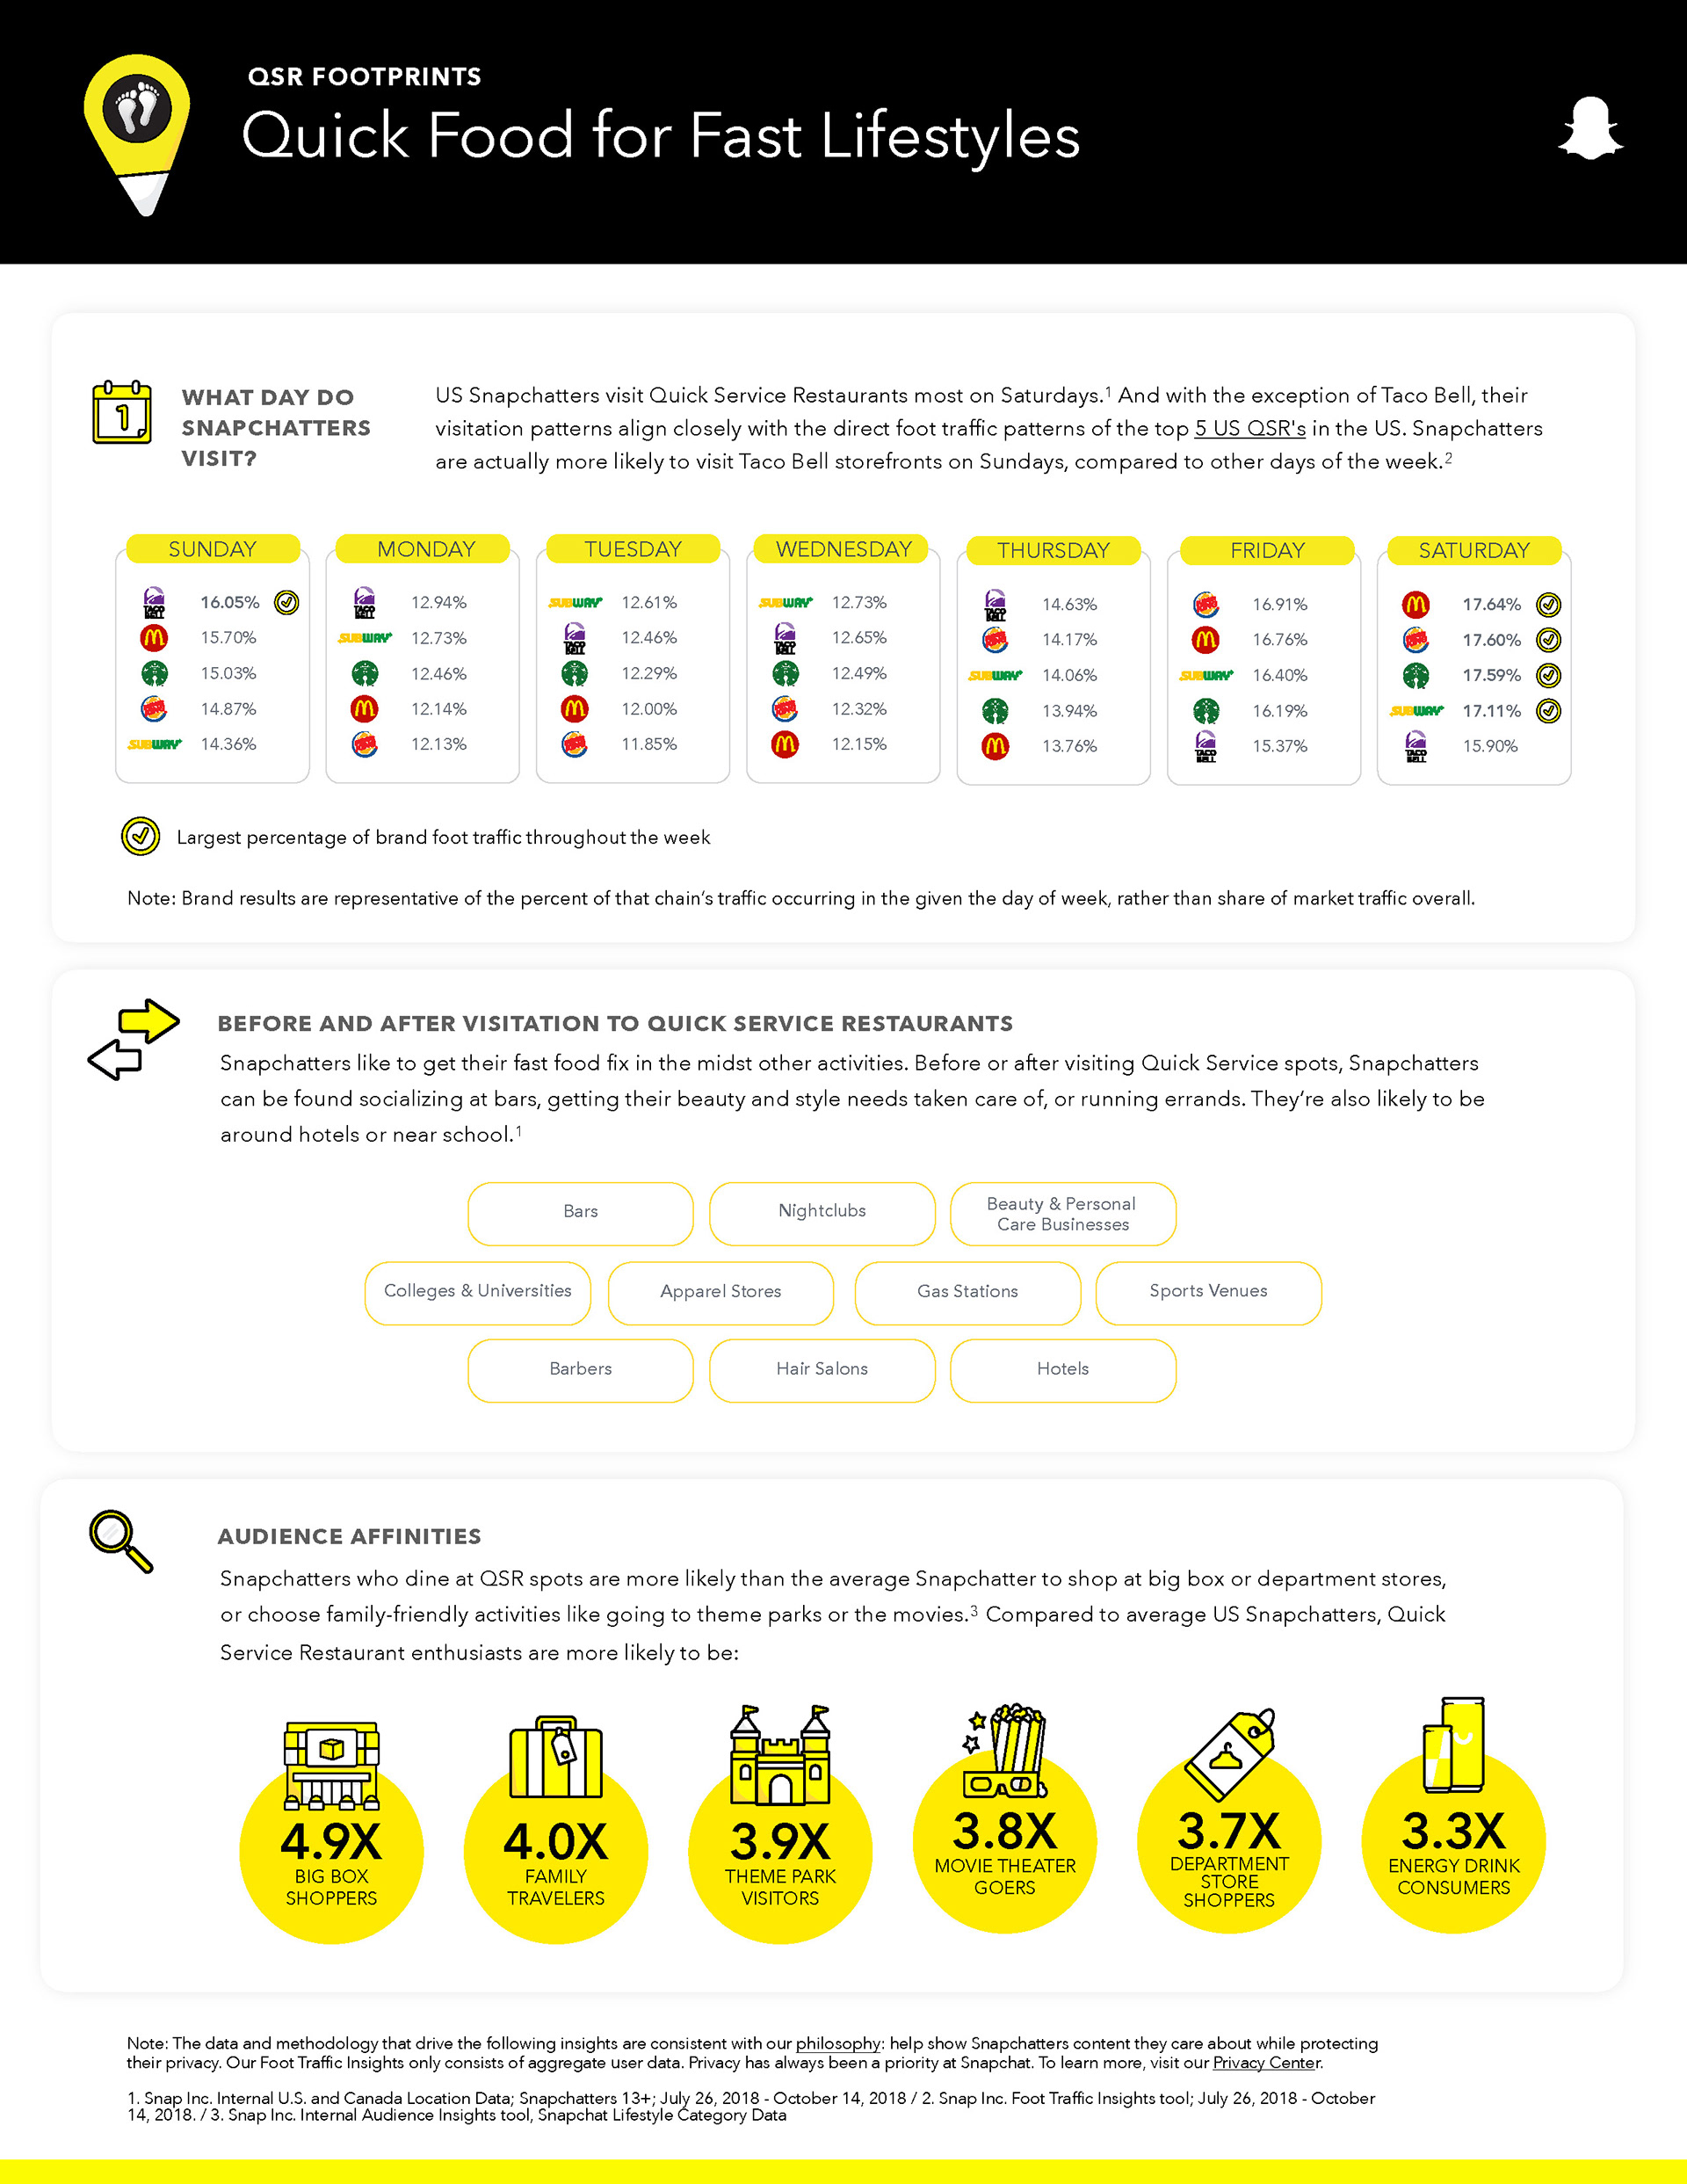
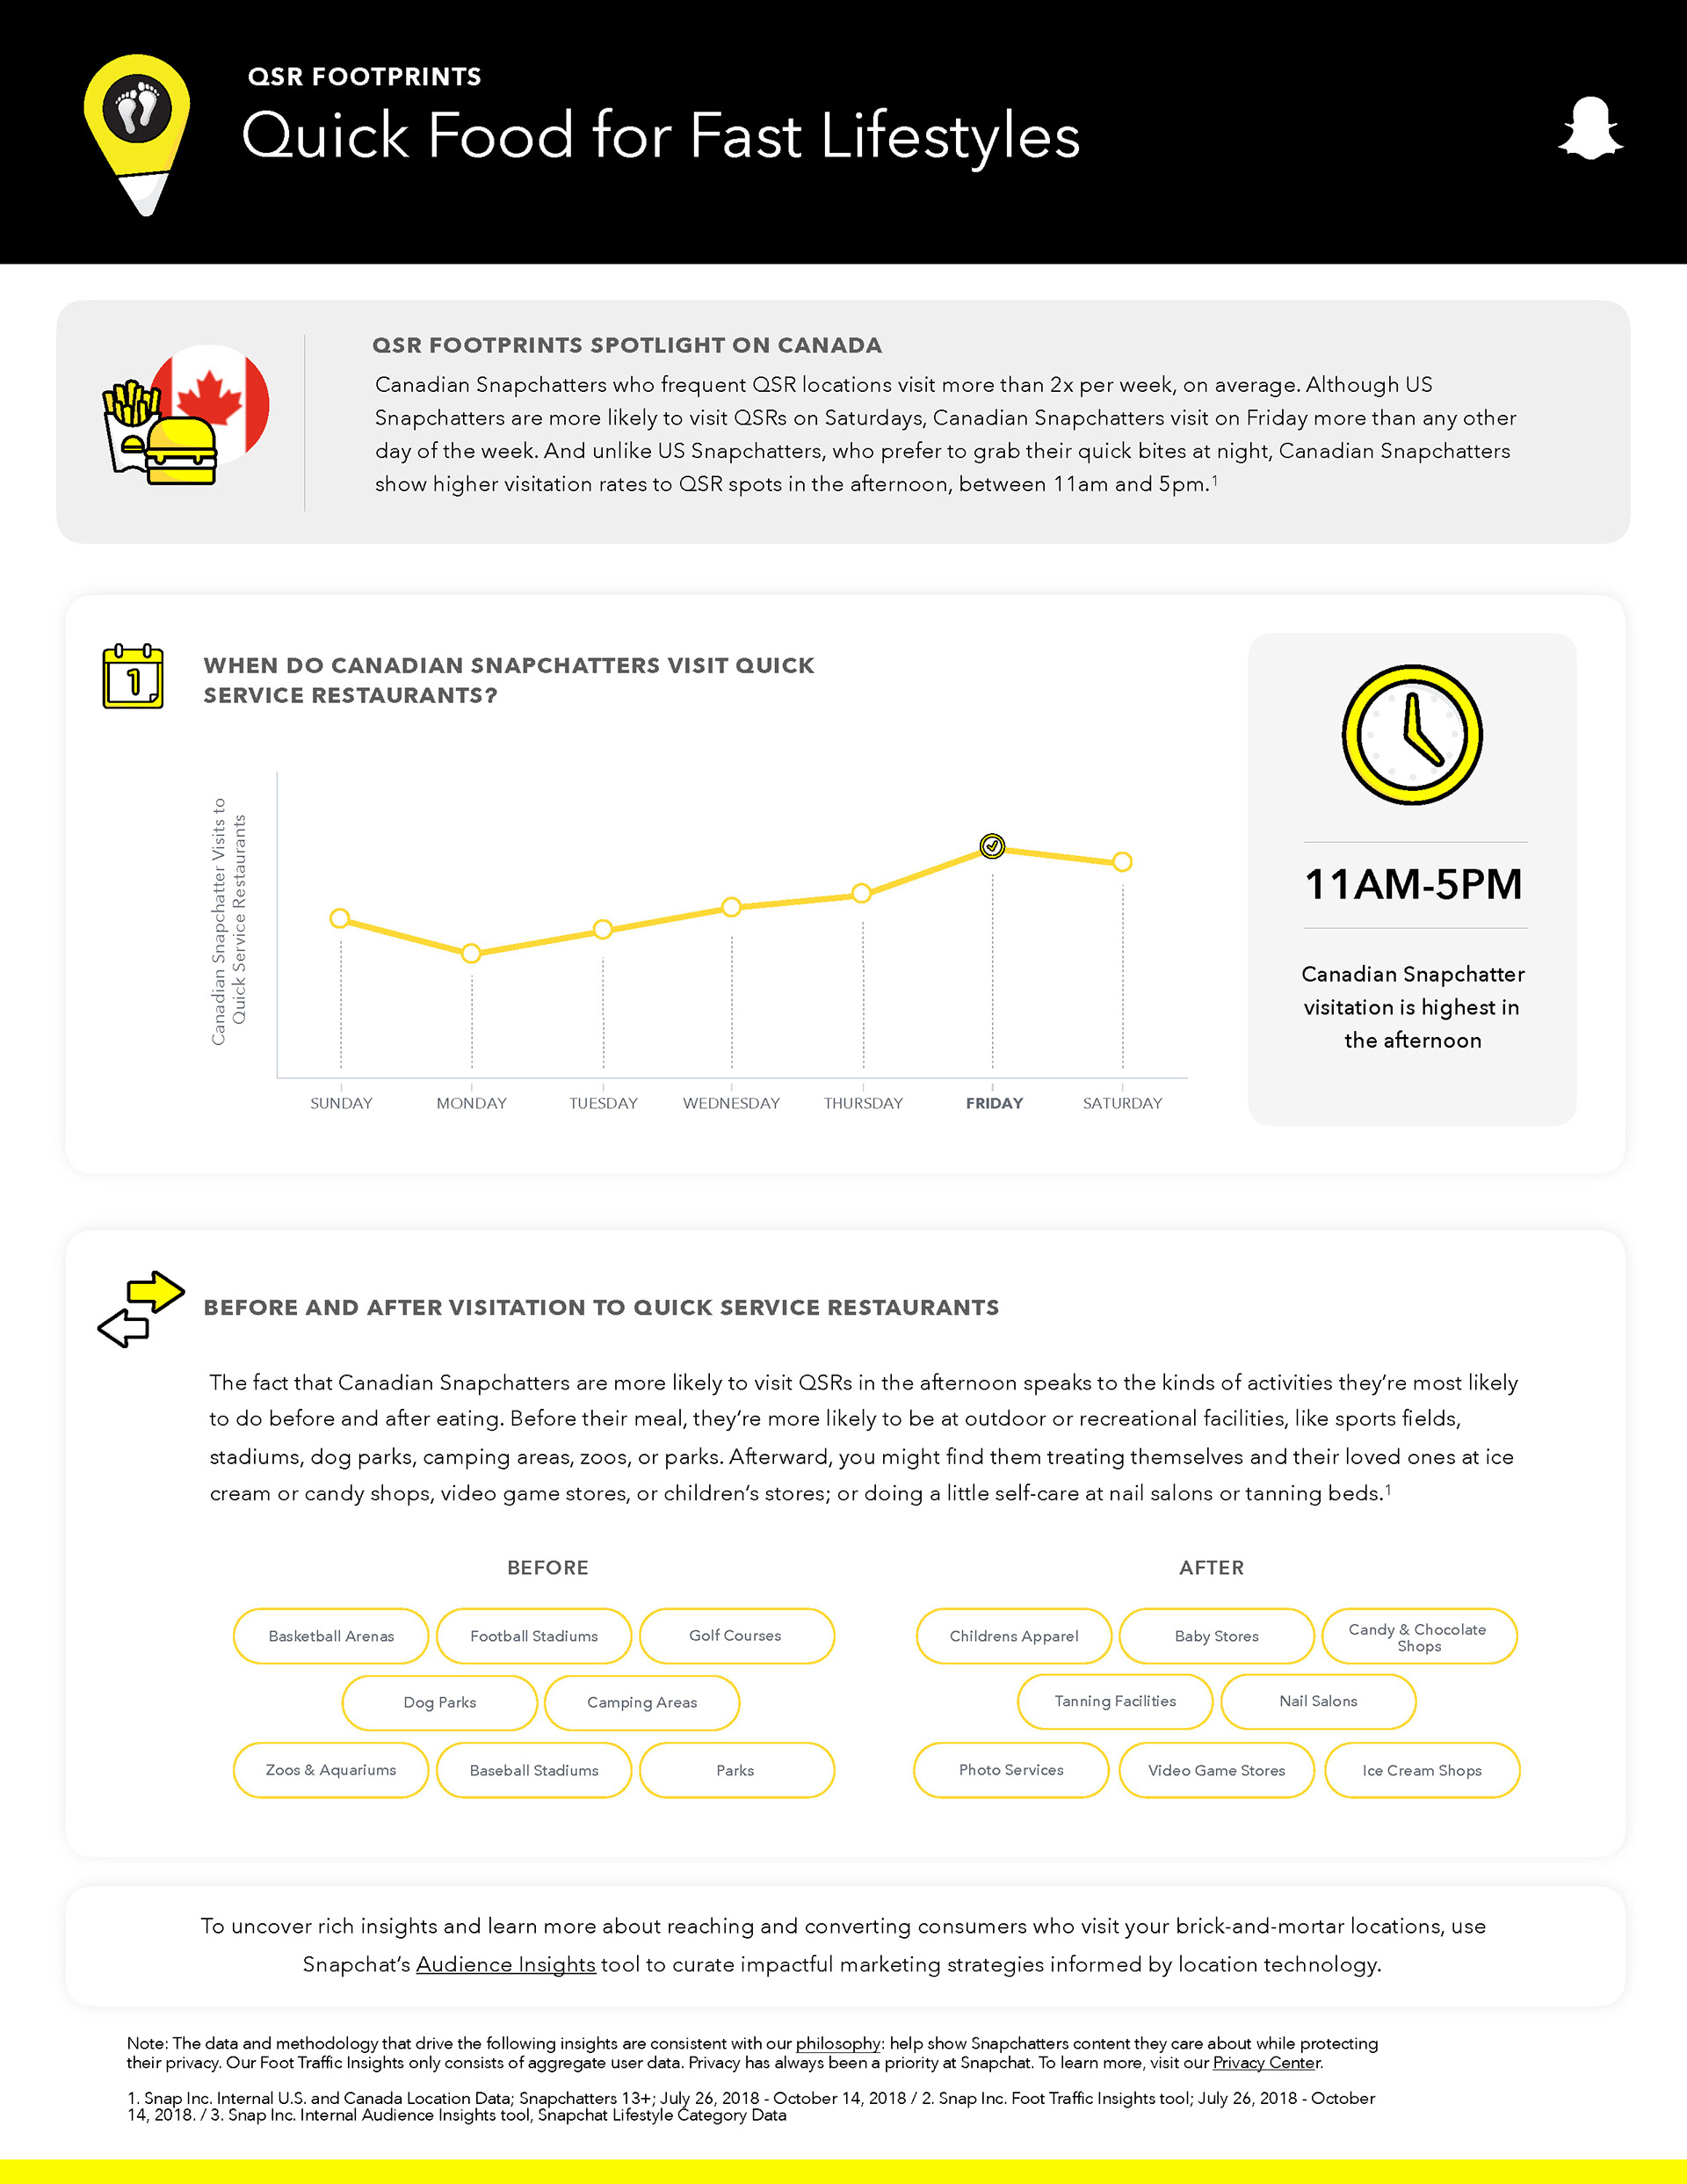
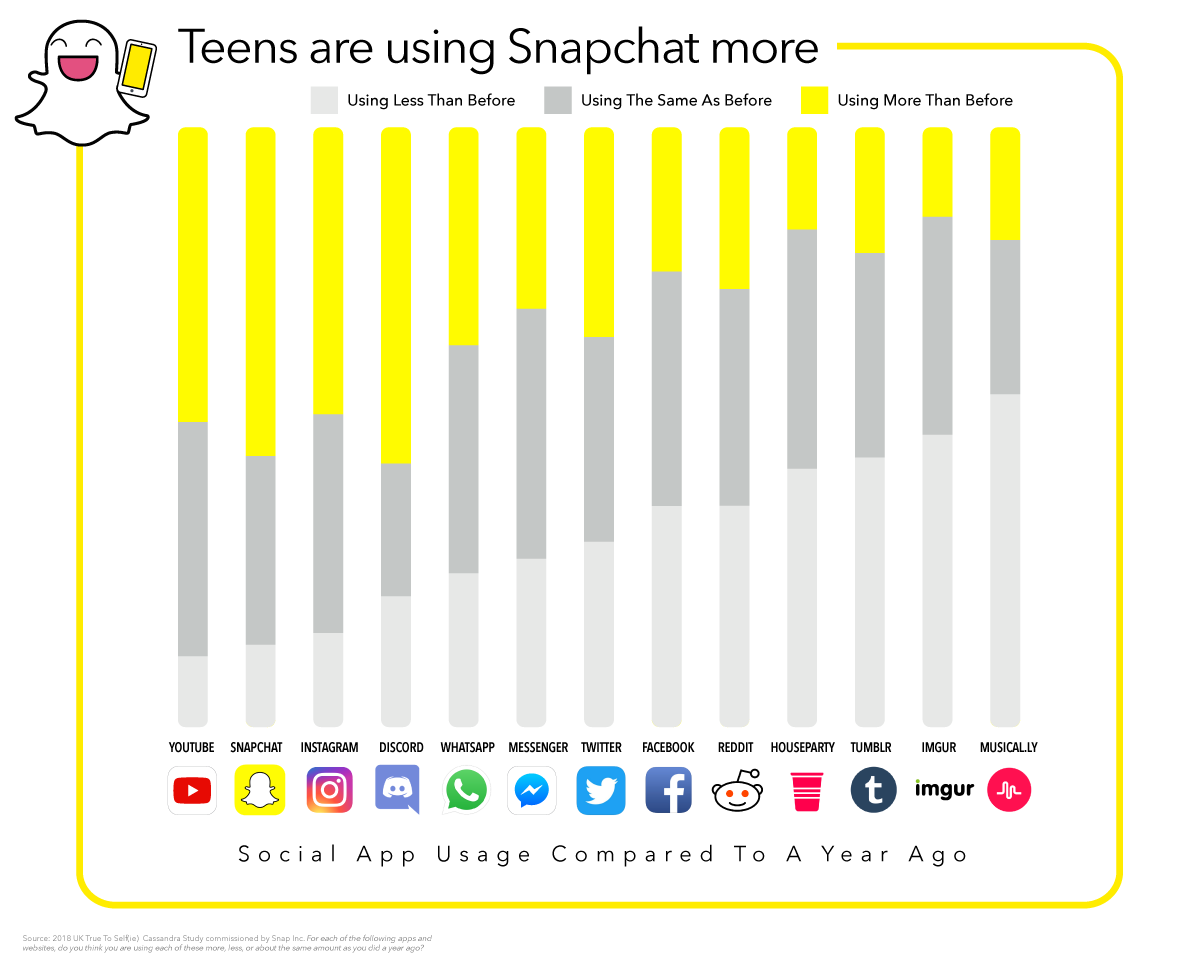
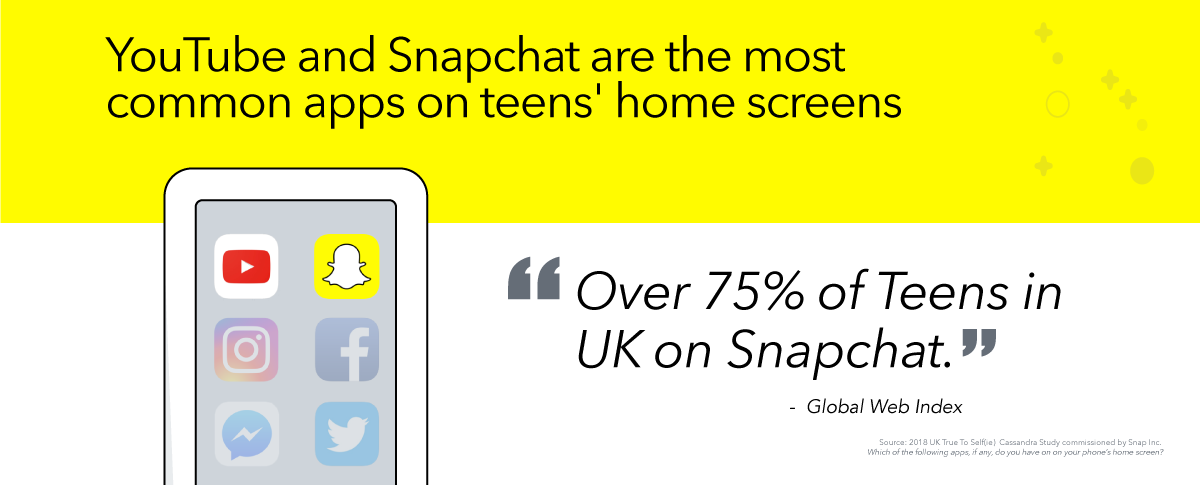
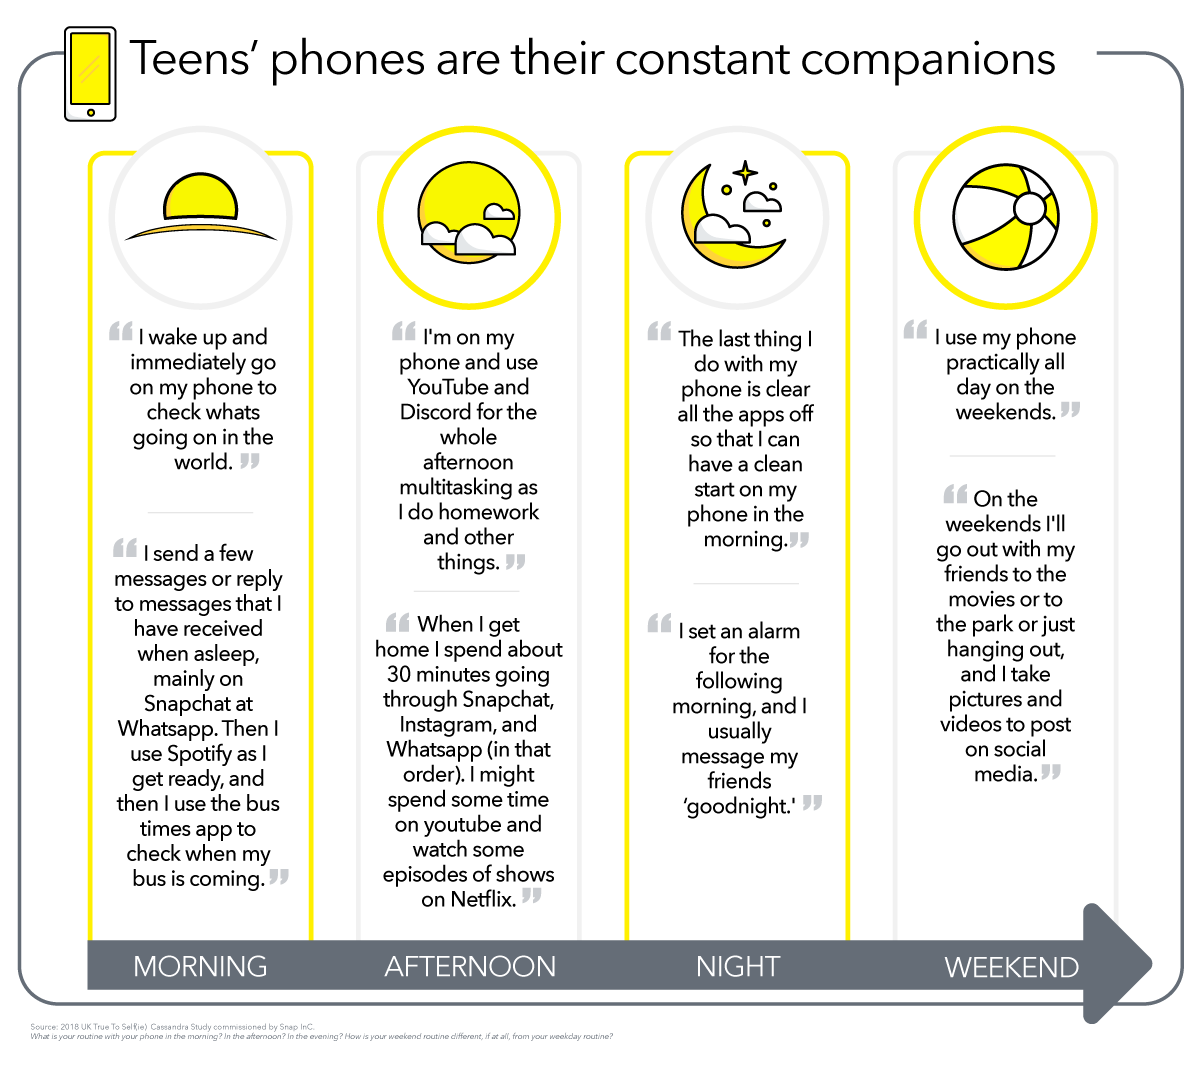
Develop a suite of dynamic data visualizations for the Snapchat B2B blog to showcase user demographic insights and behavioral trends to global advertisers. The objective was to transform complex research study findings into shareable, high-impact digital assets that illustrate the unique influence and purchasing power of the Snapchat community.
STRATEGY
I prioritized visual storytelling by integrating custom character illustrations with technical charts, ensuring the data felt relatable rather than abstract. By utilizing a high-contrast yellow, black, and white palette, I created a cohesive aesthetic that maintained brand authority while breaking down dense statistics—such as user engagement and app comparisons—into instantly digestible, mobile-friendly graphics.

CLIENTS


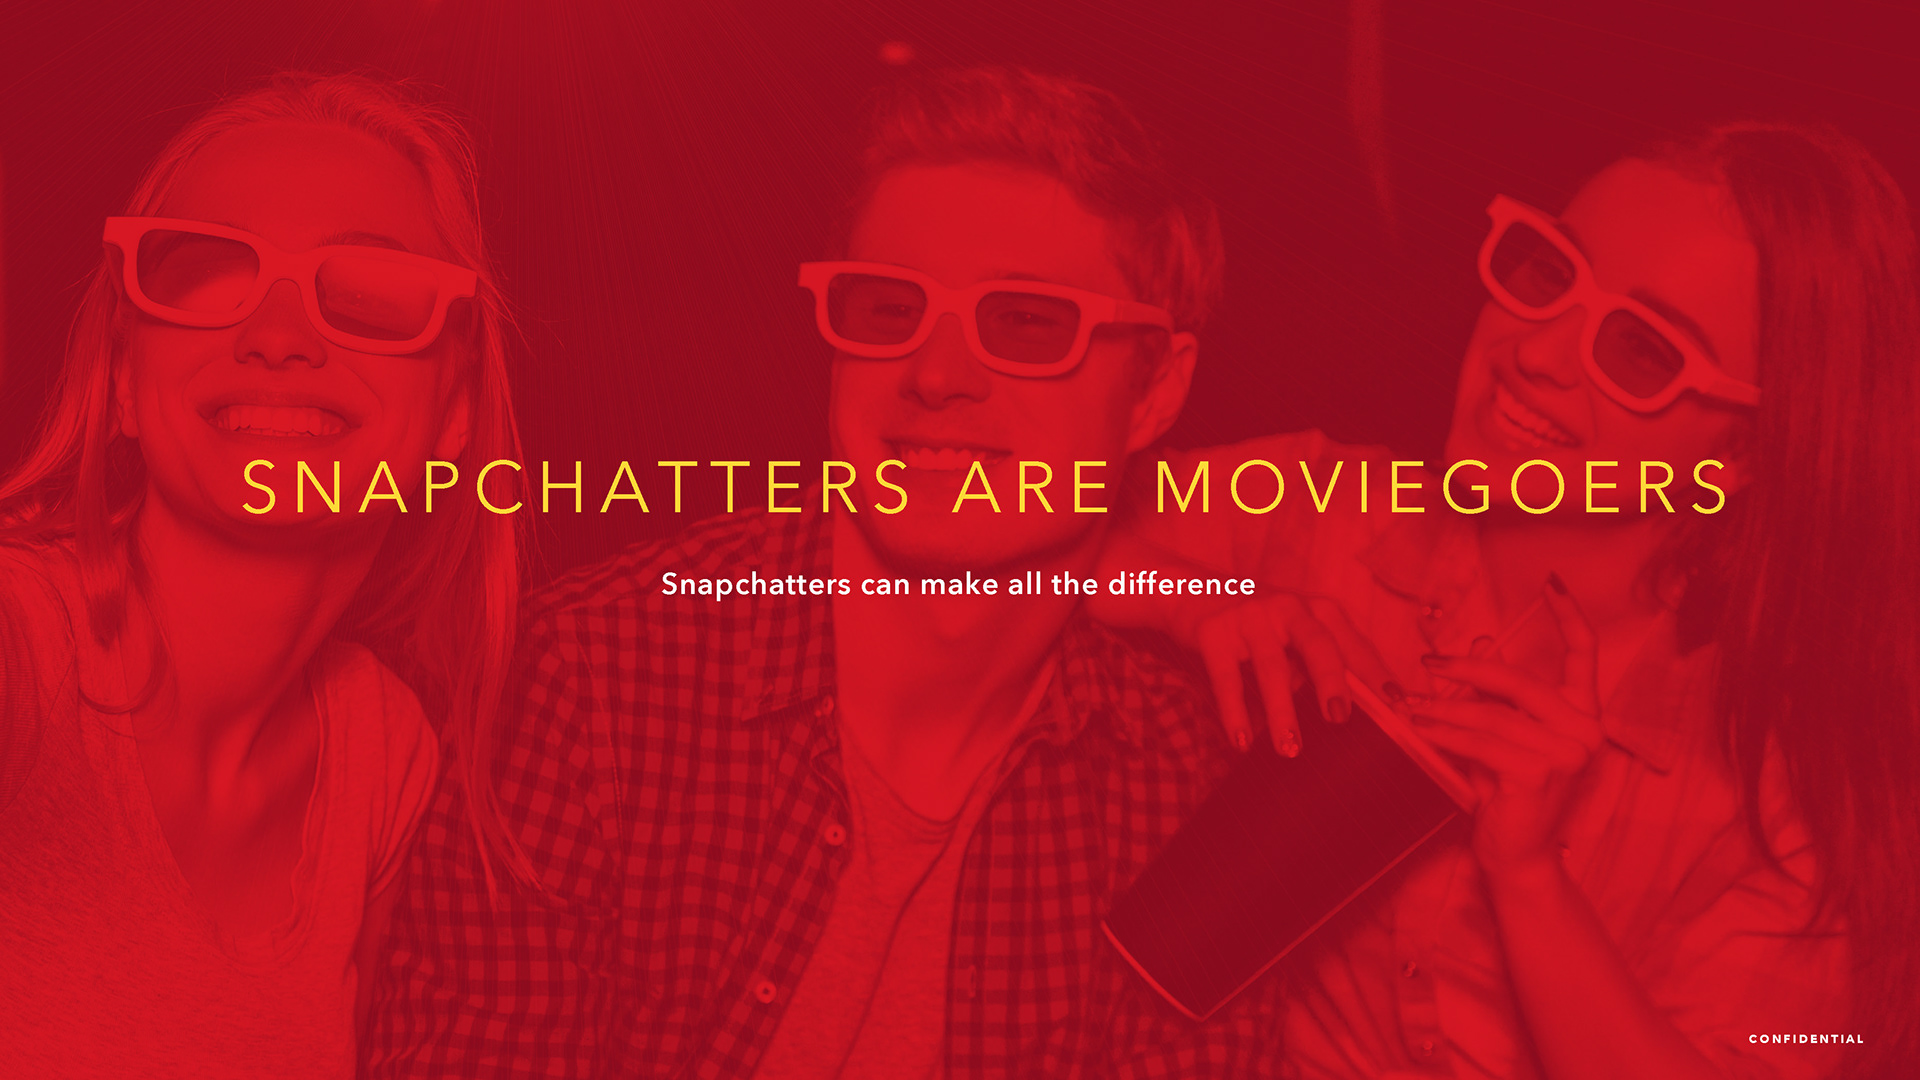
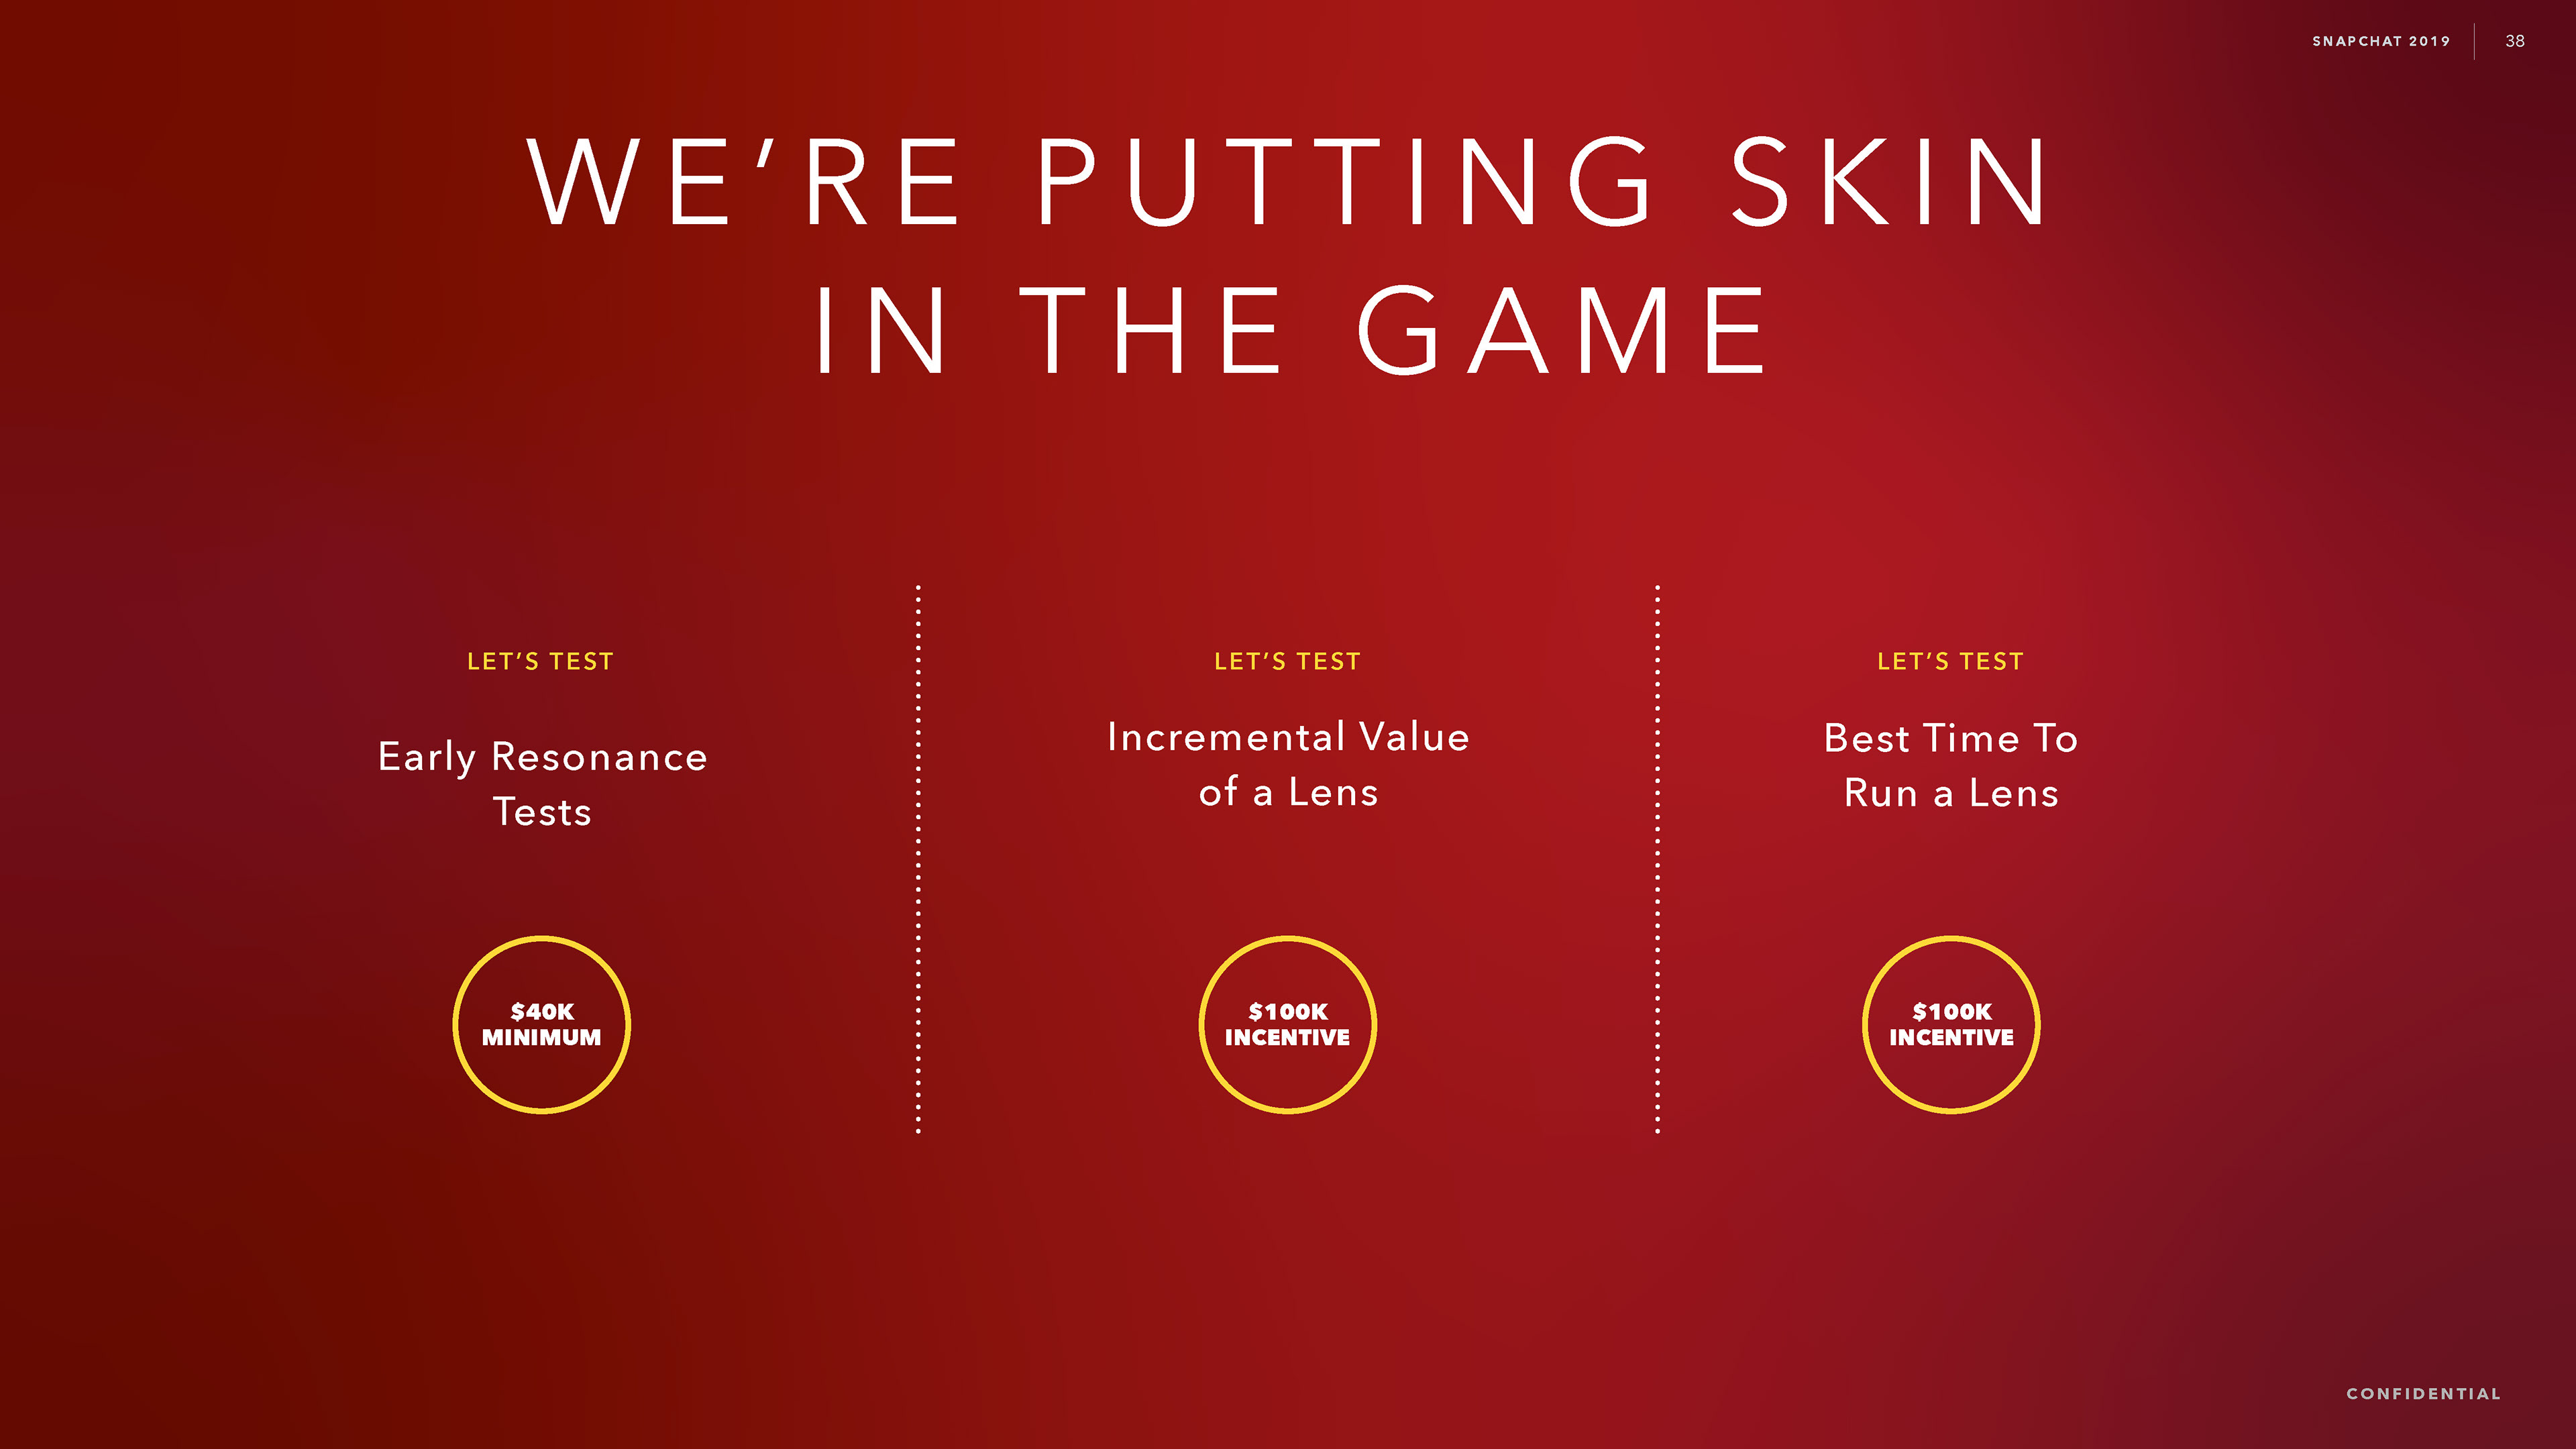
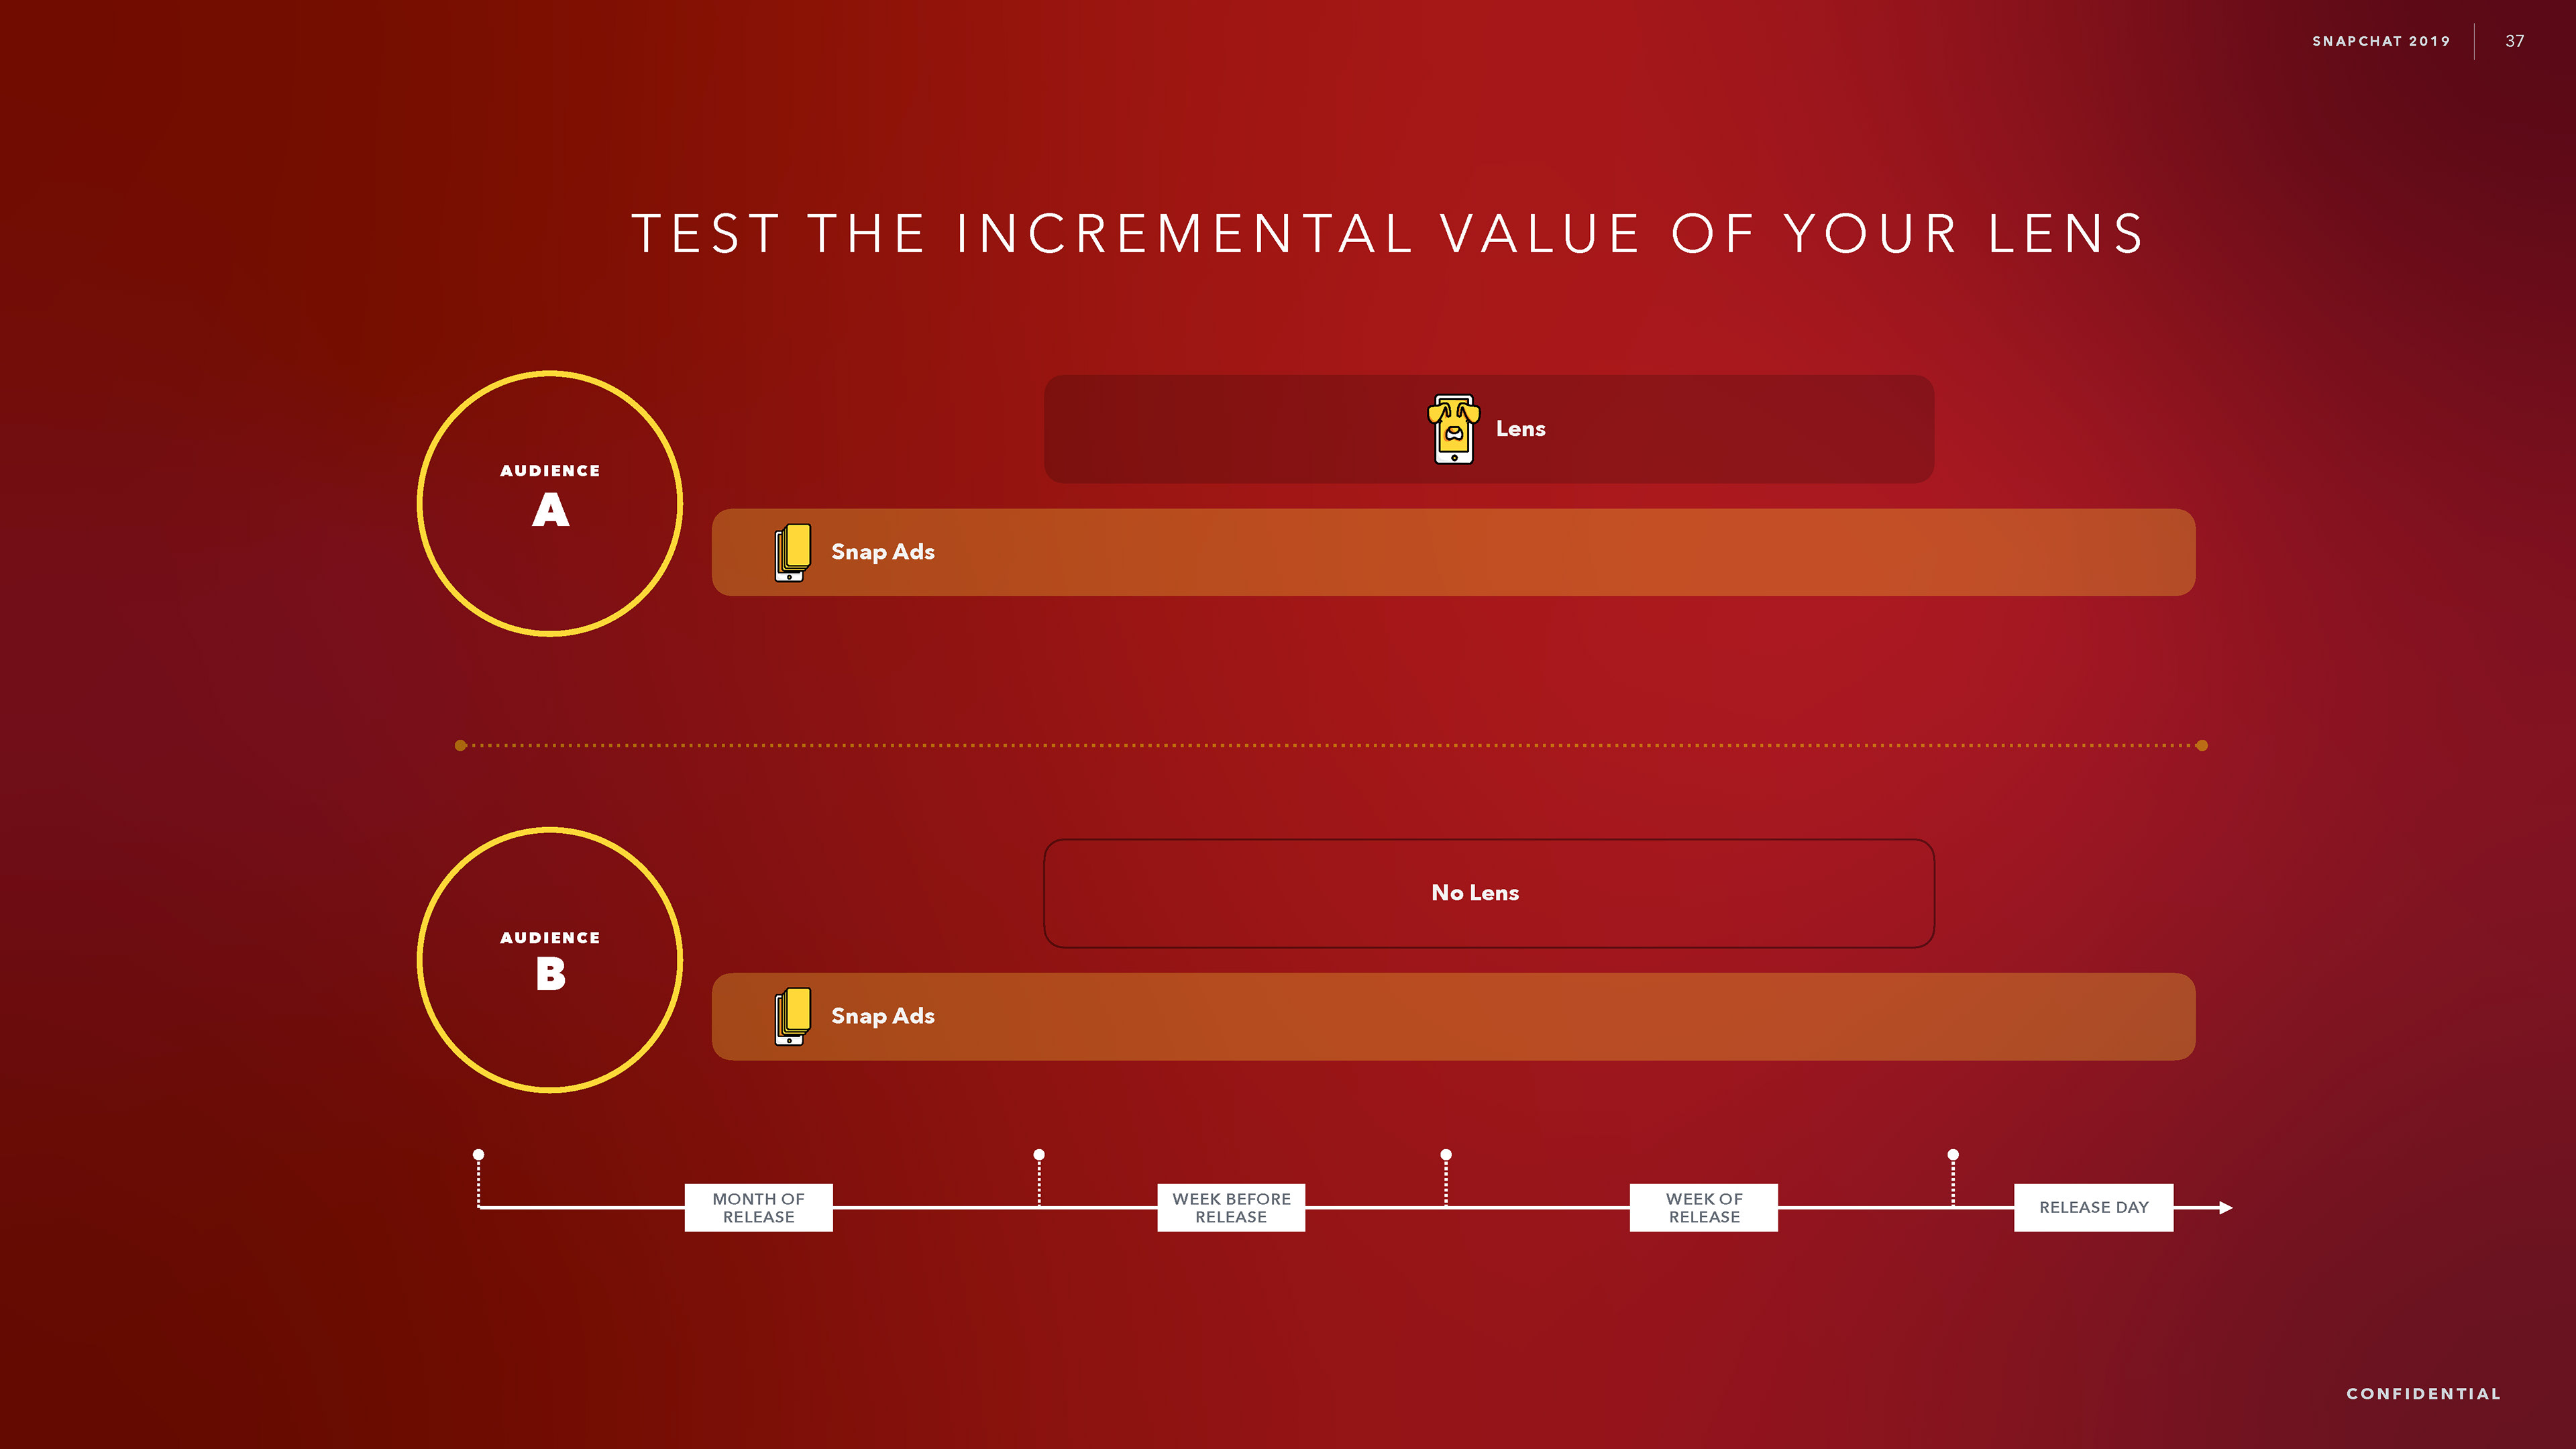
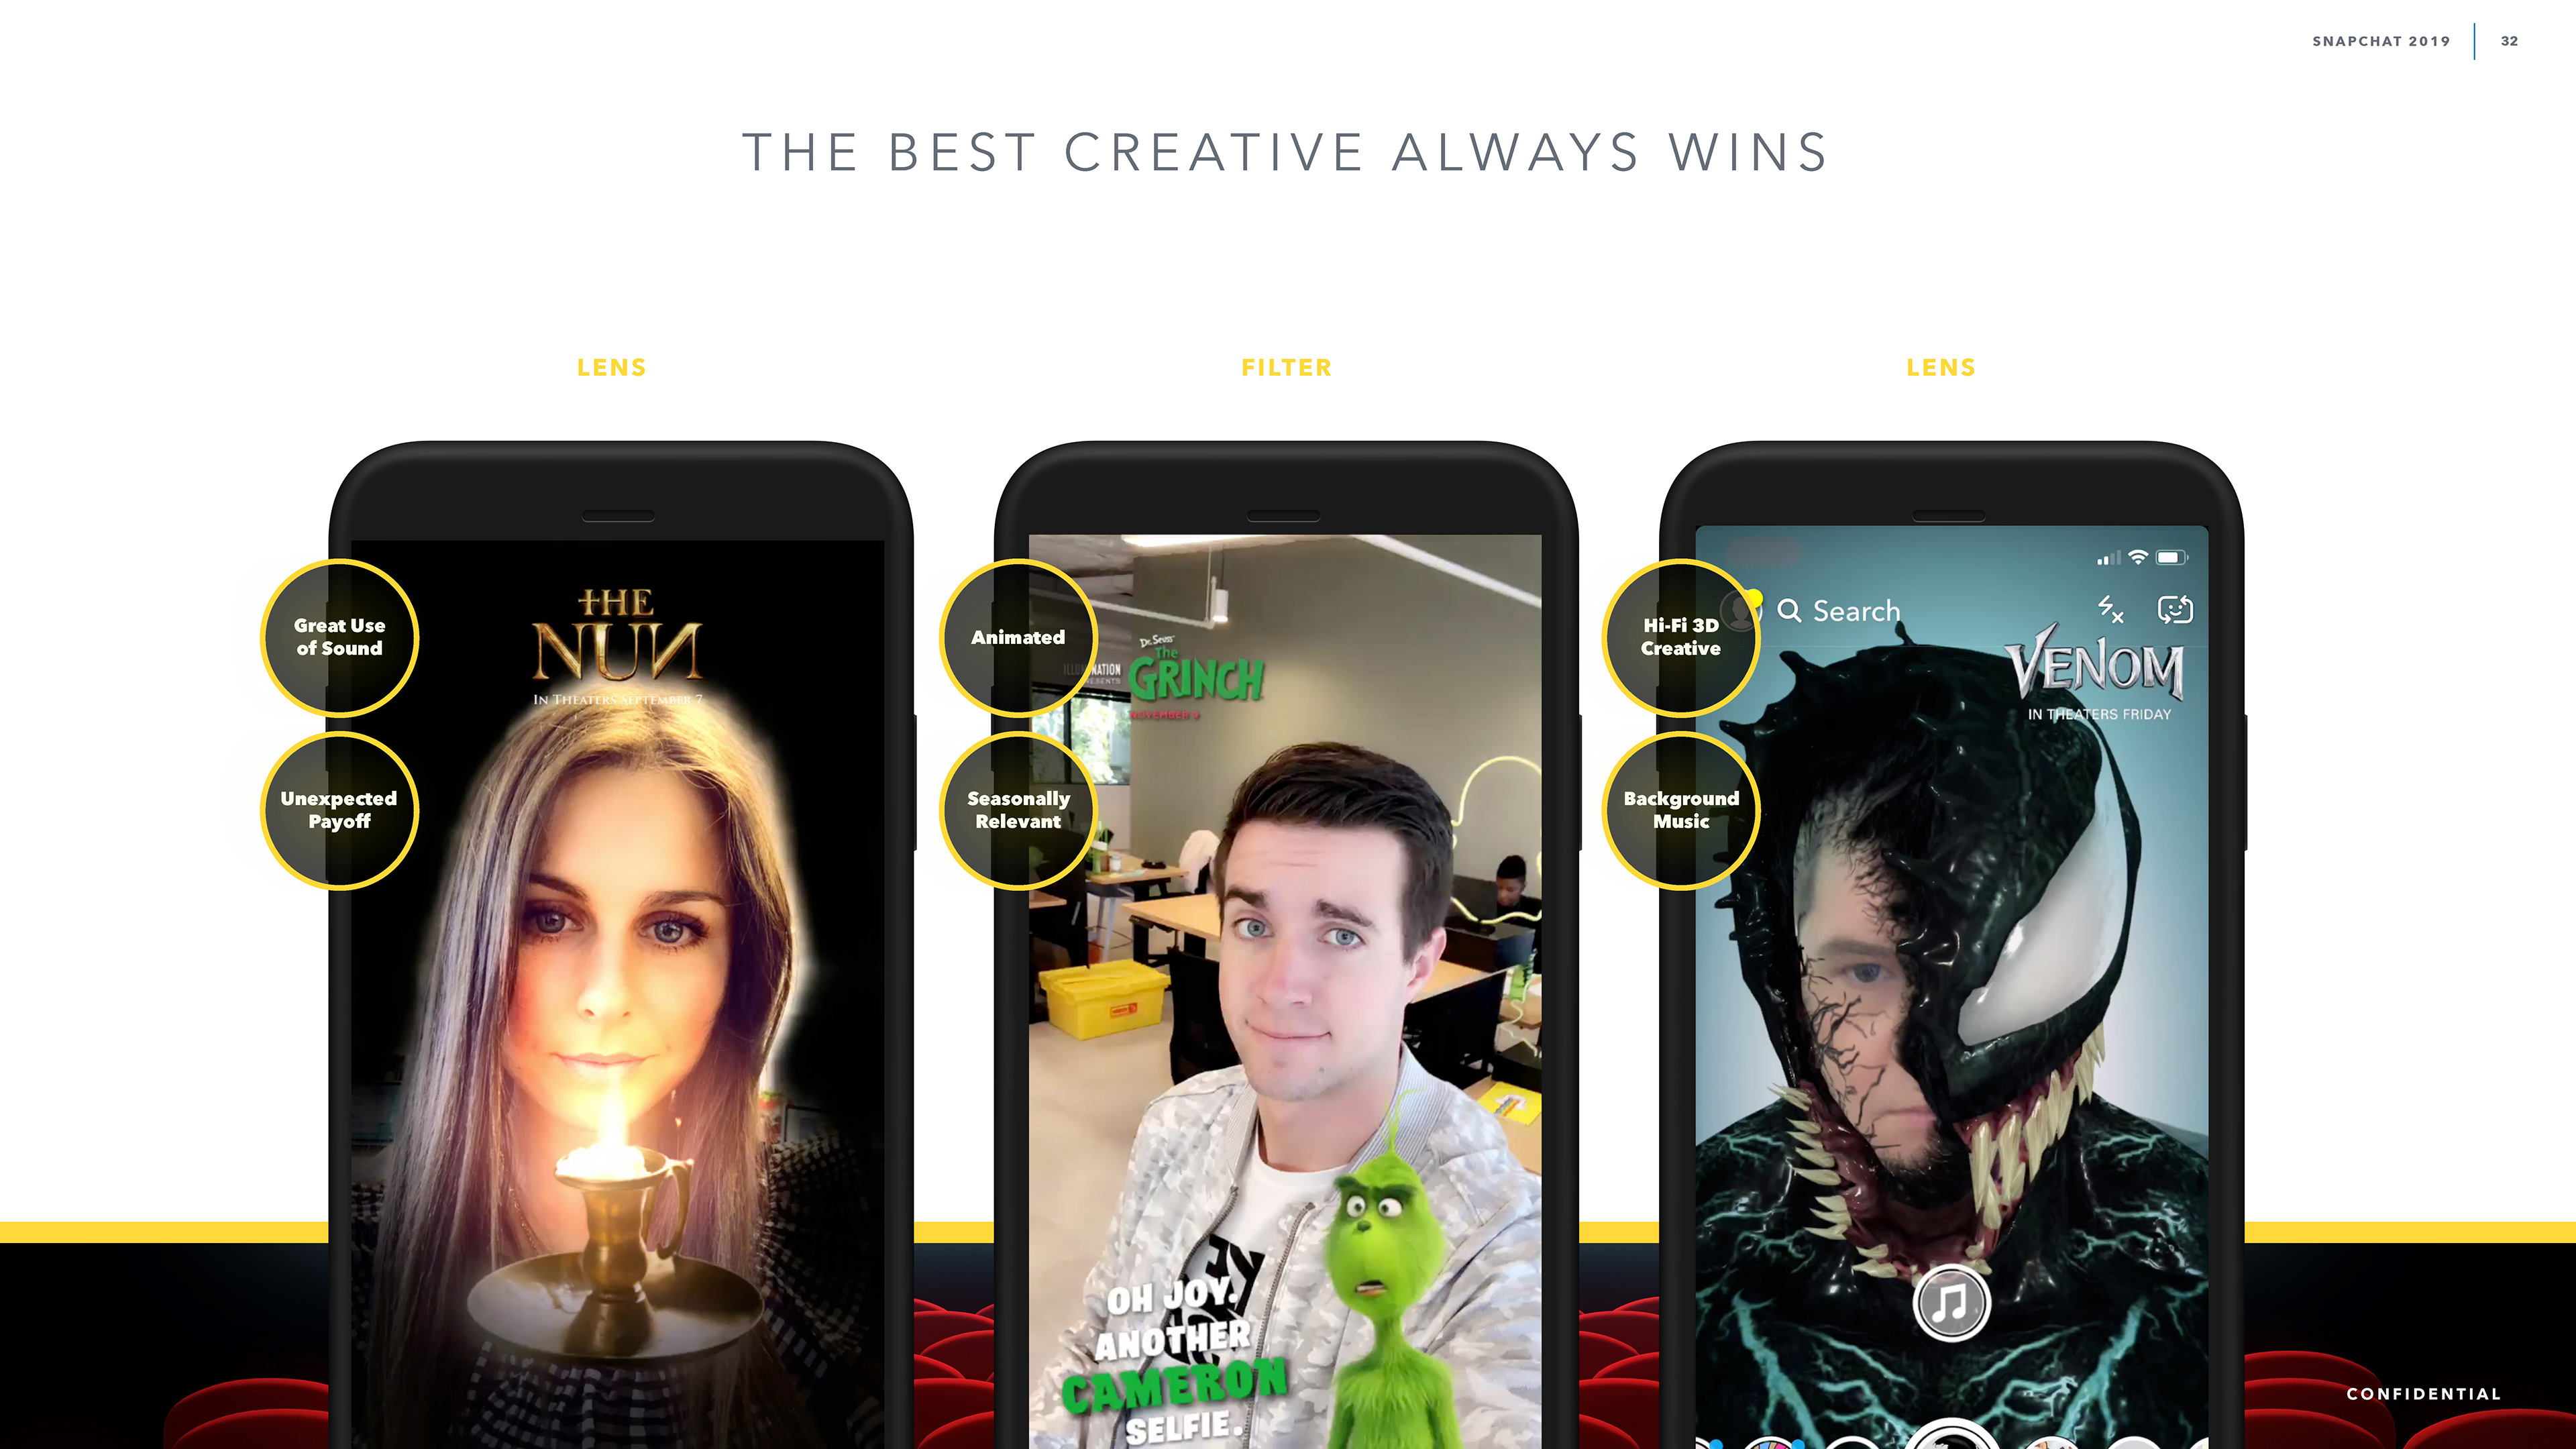
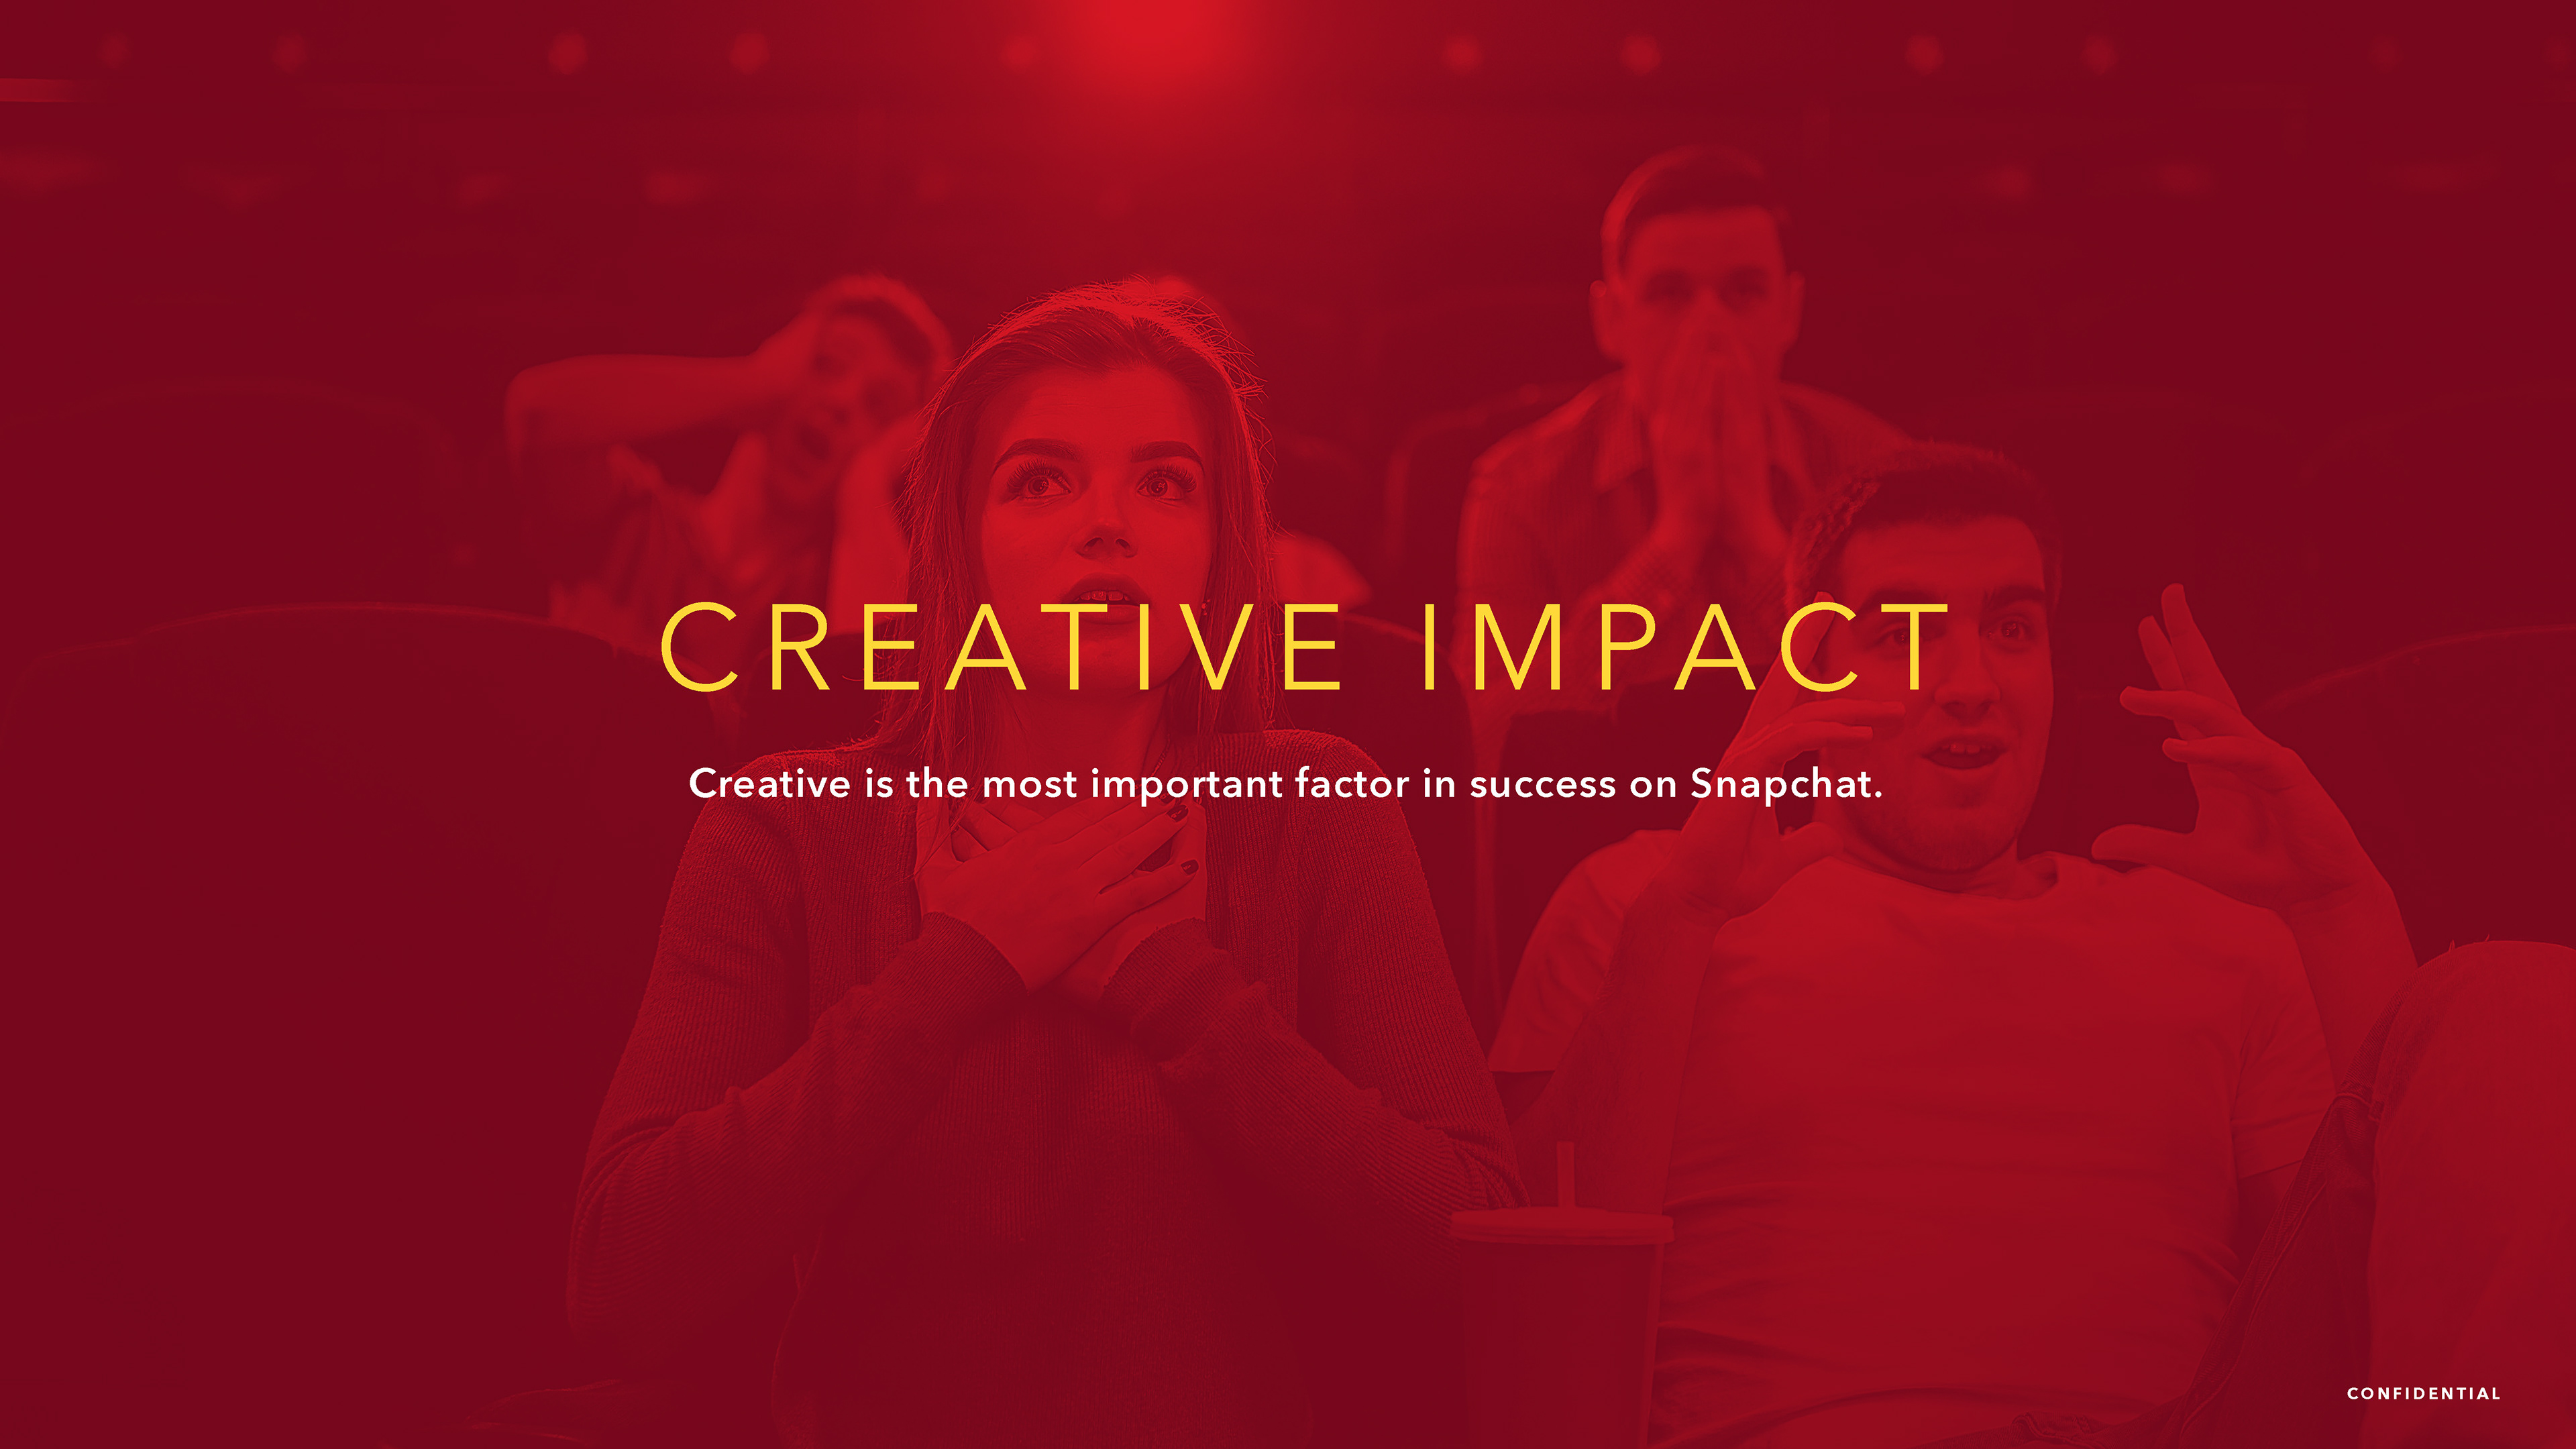
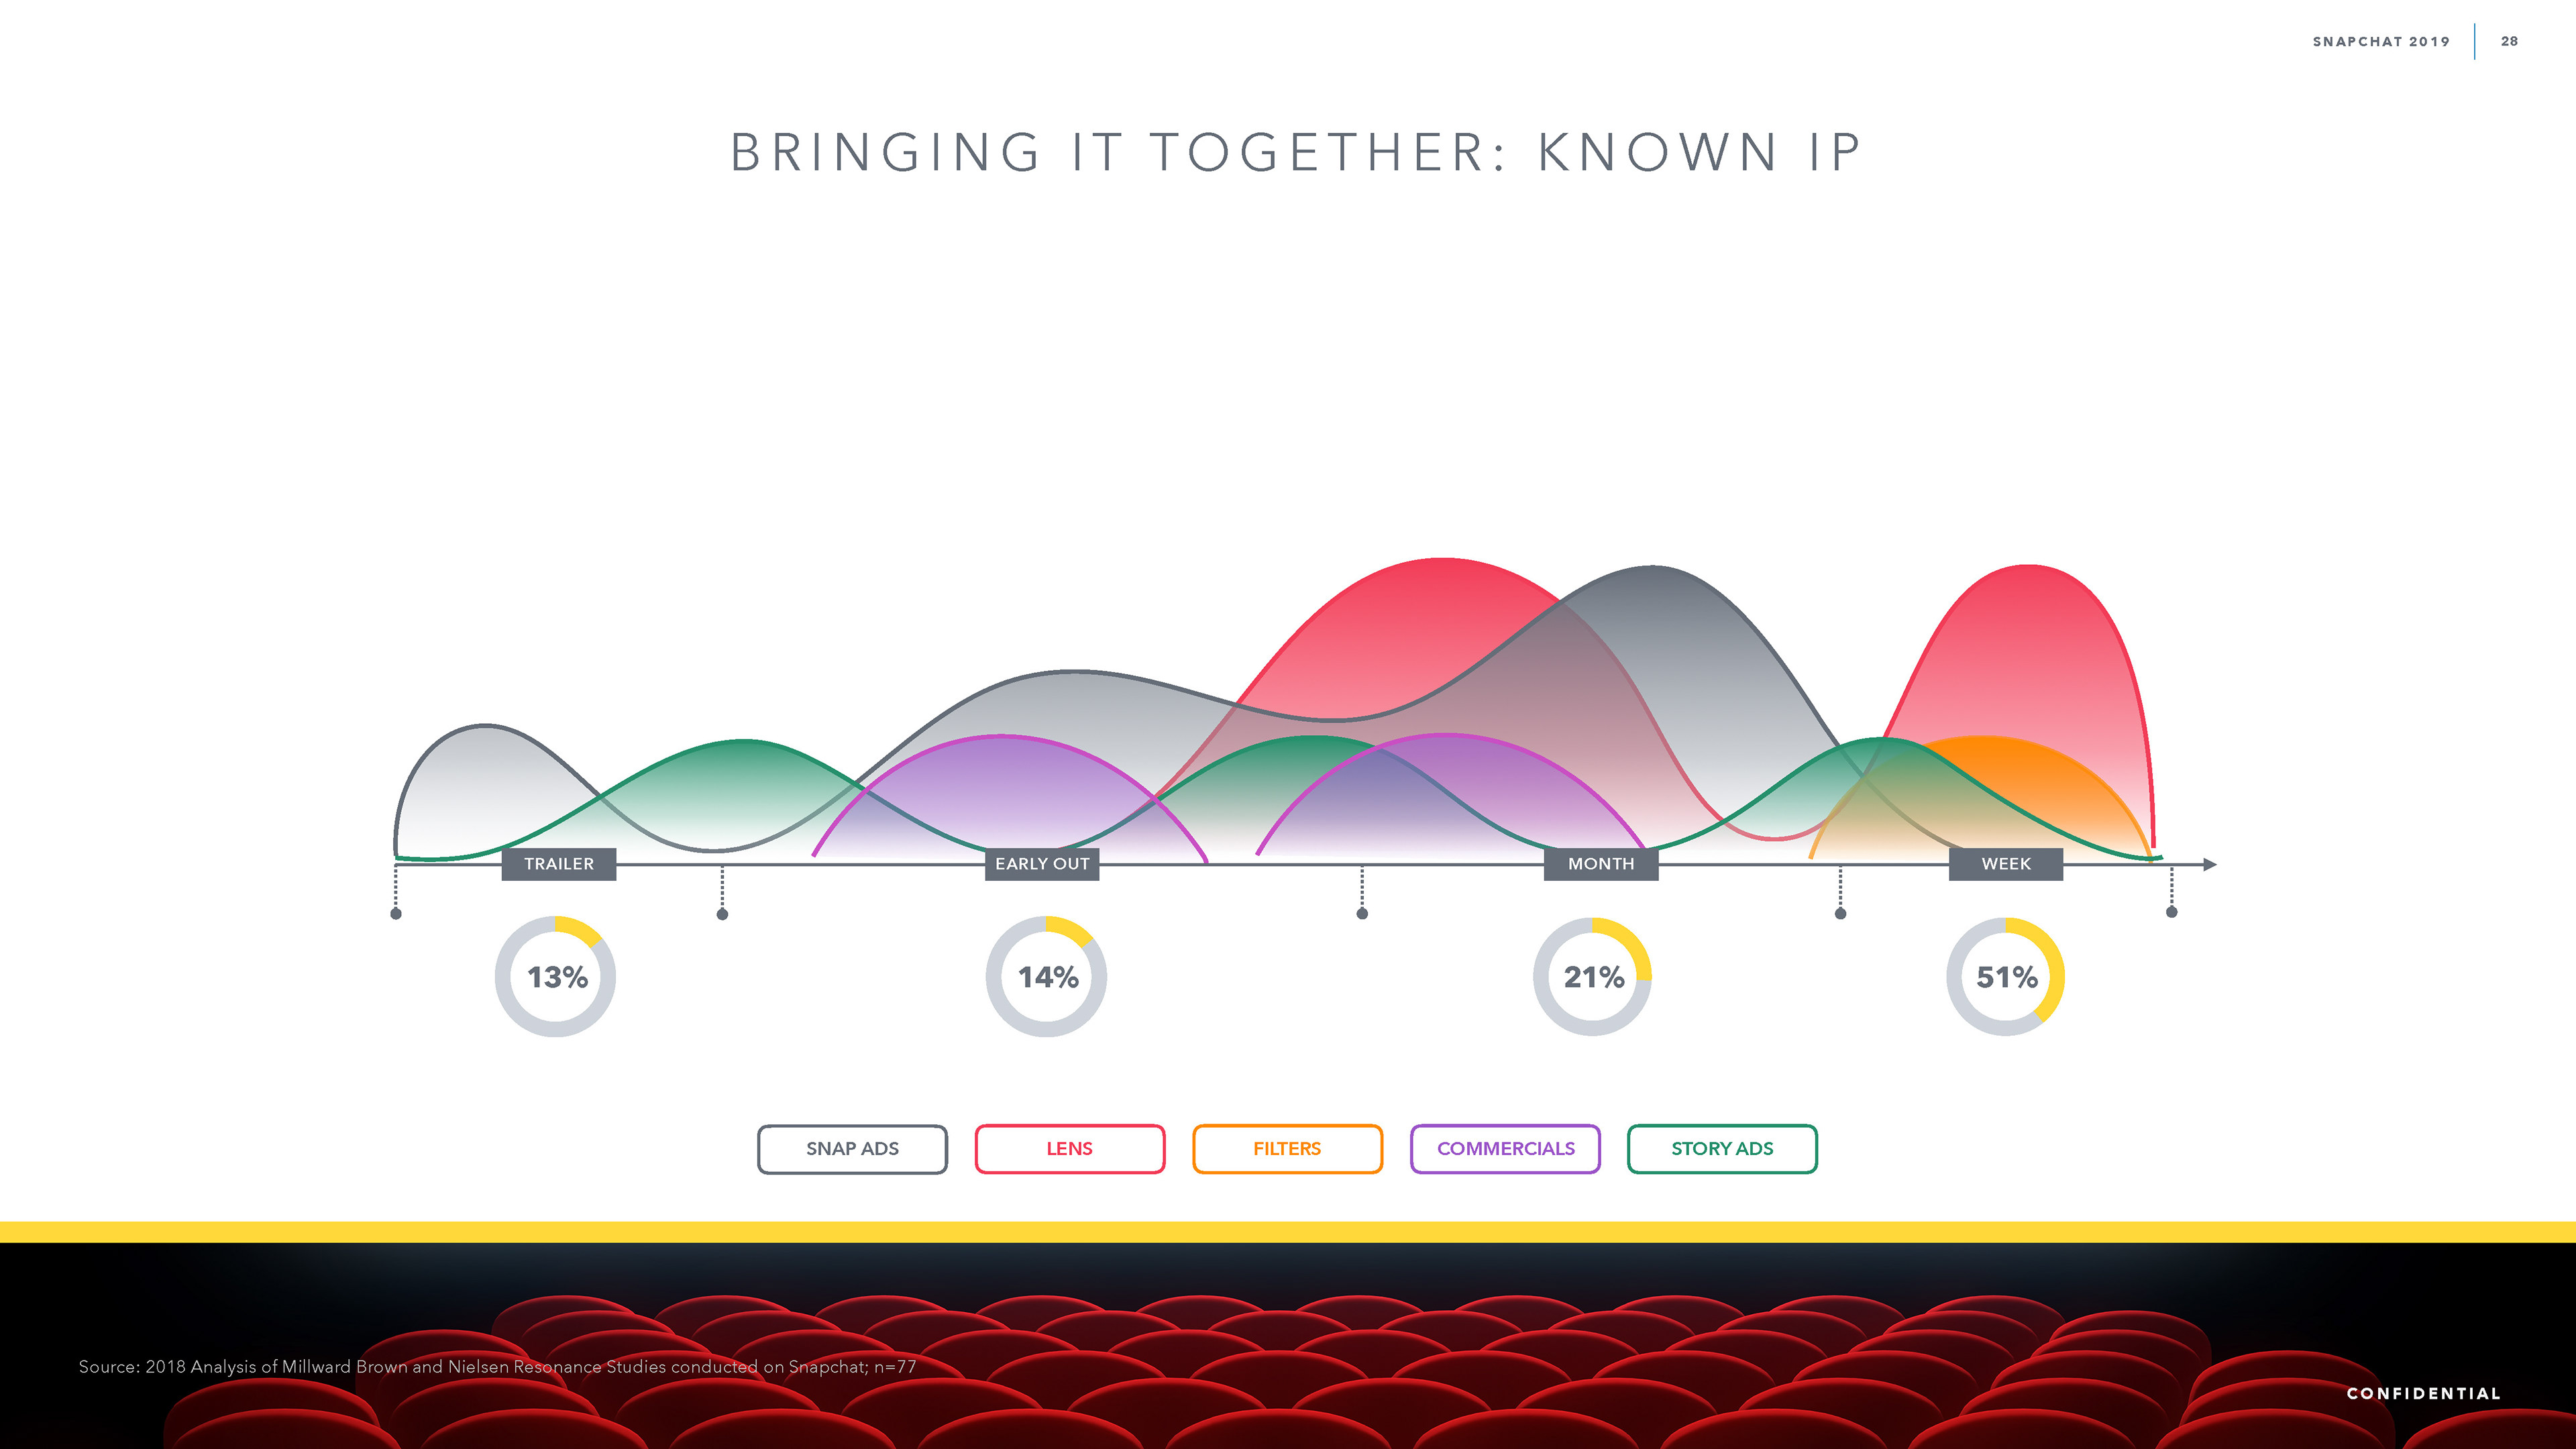
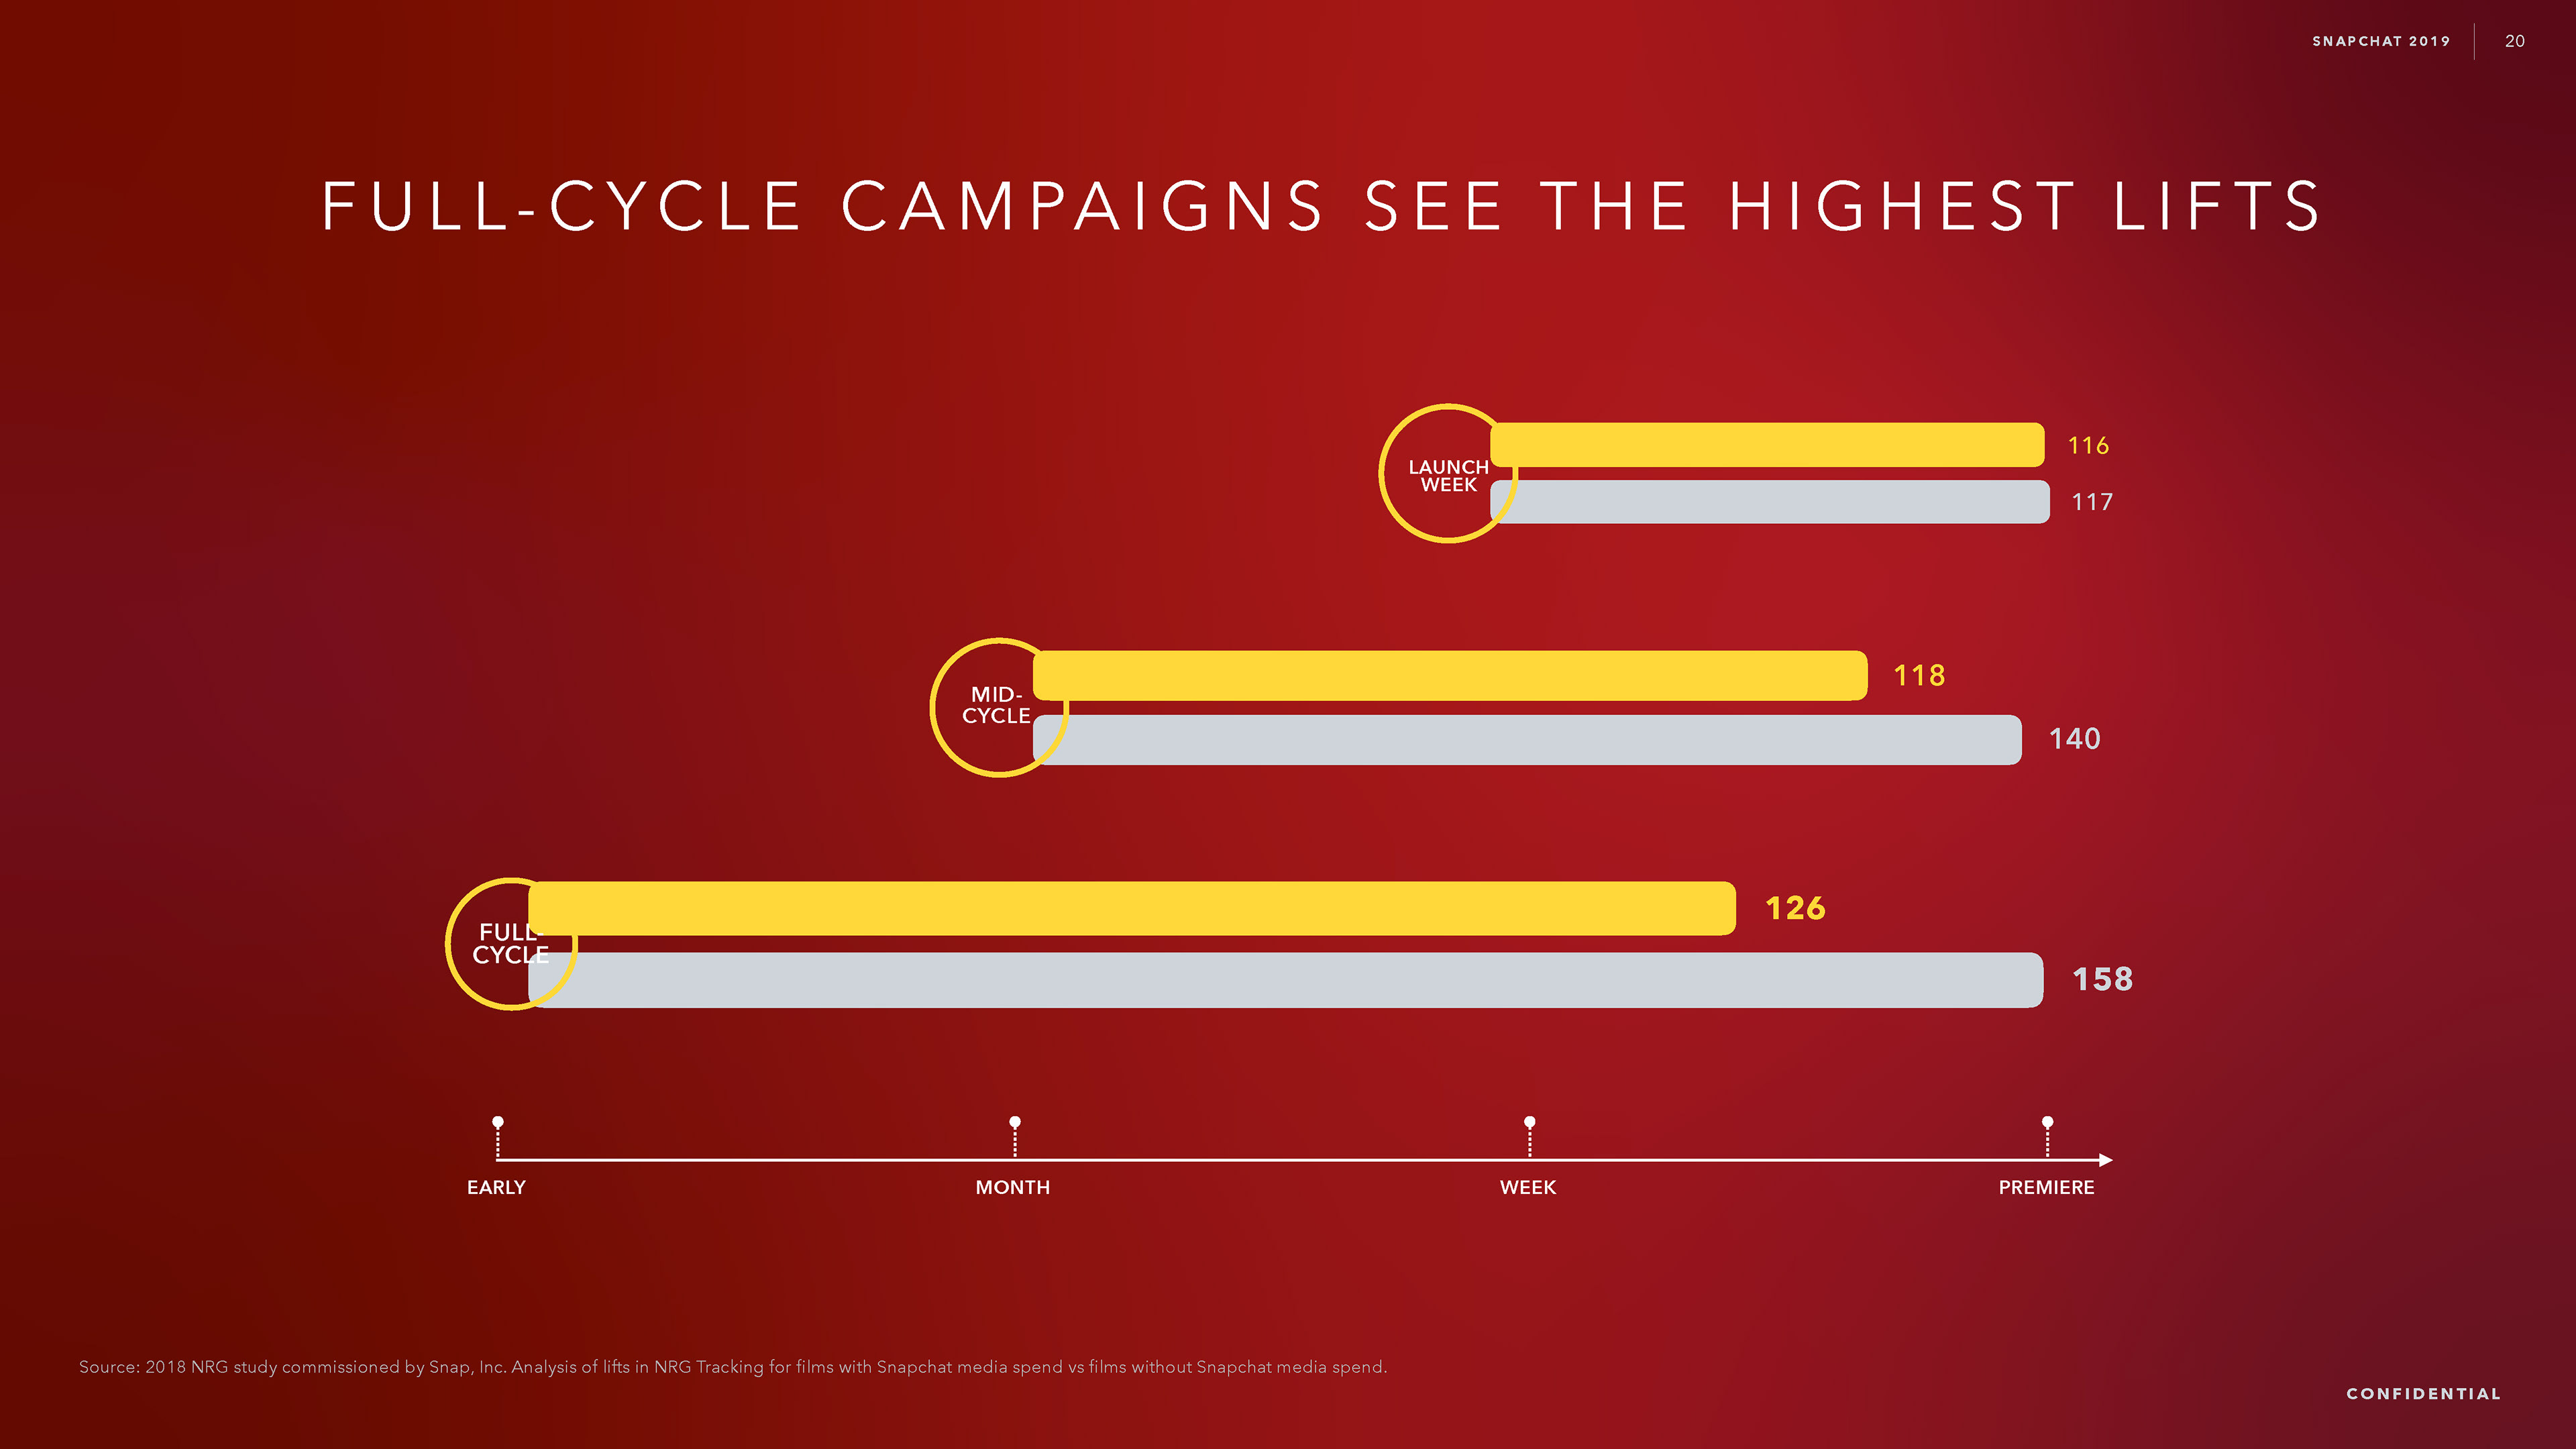
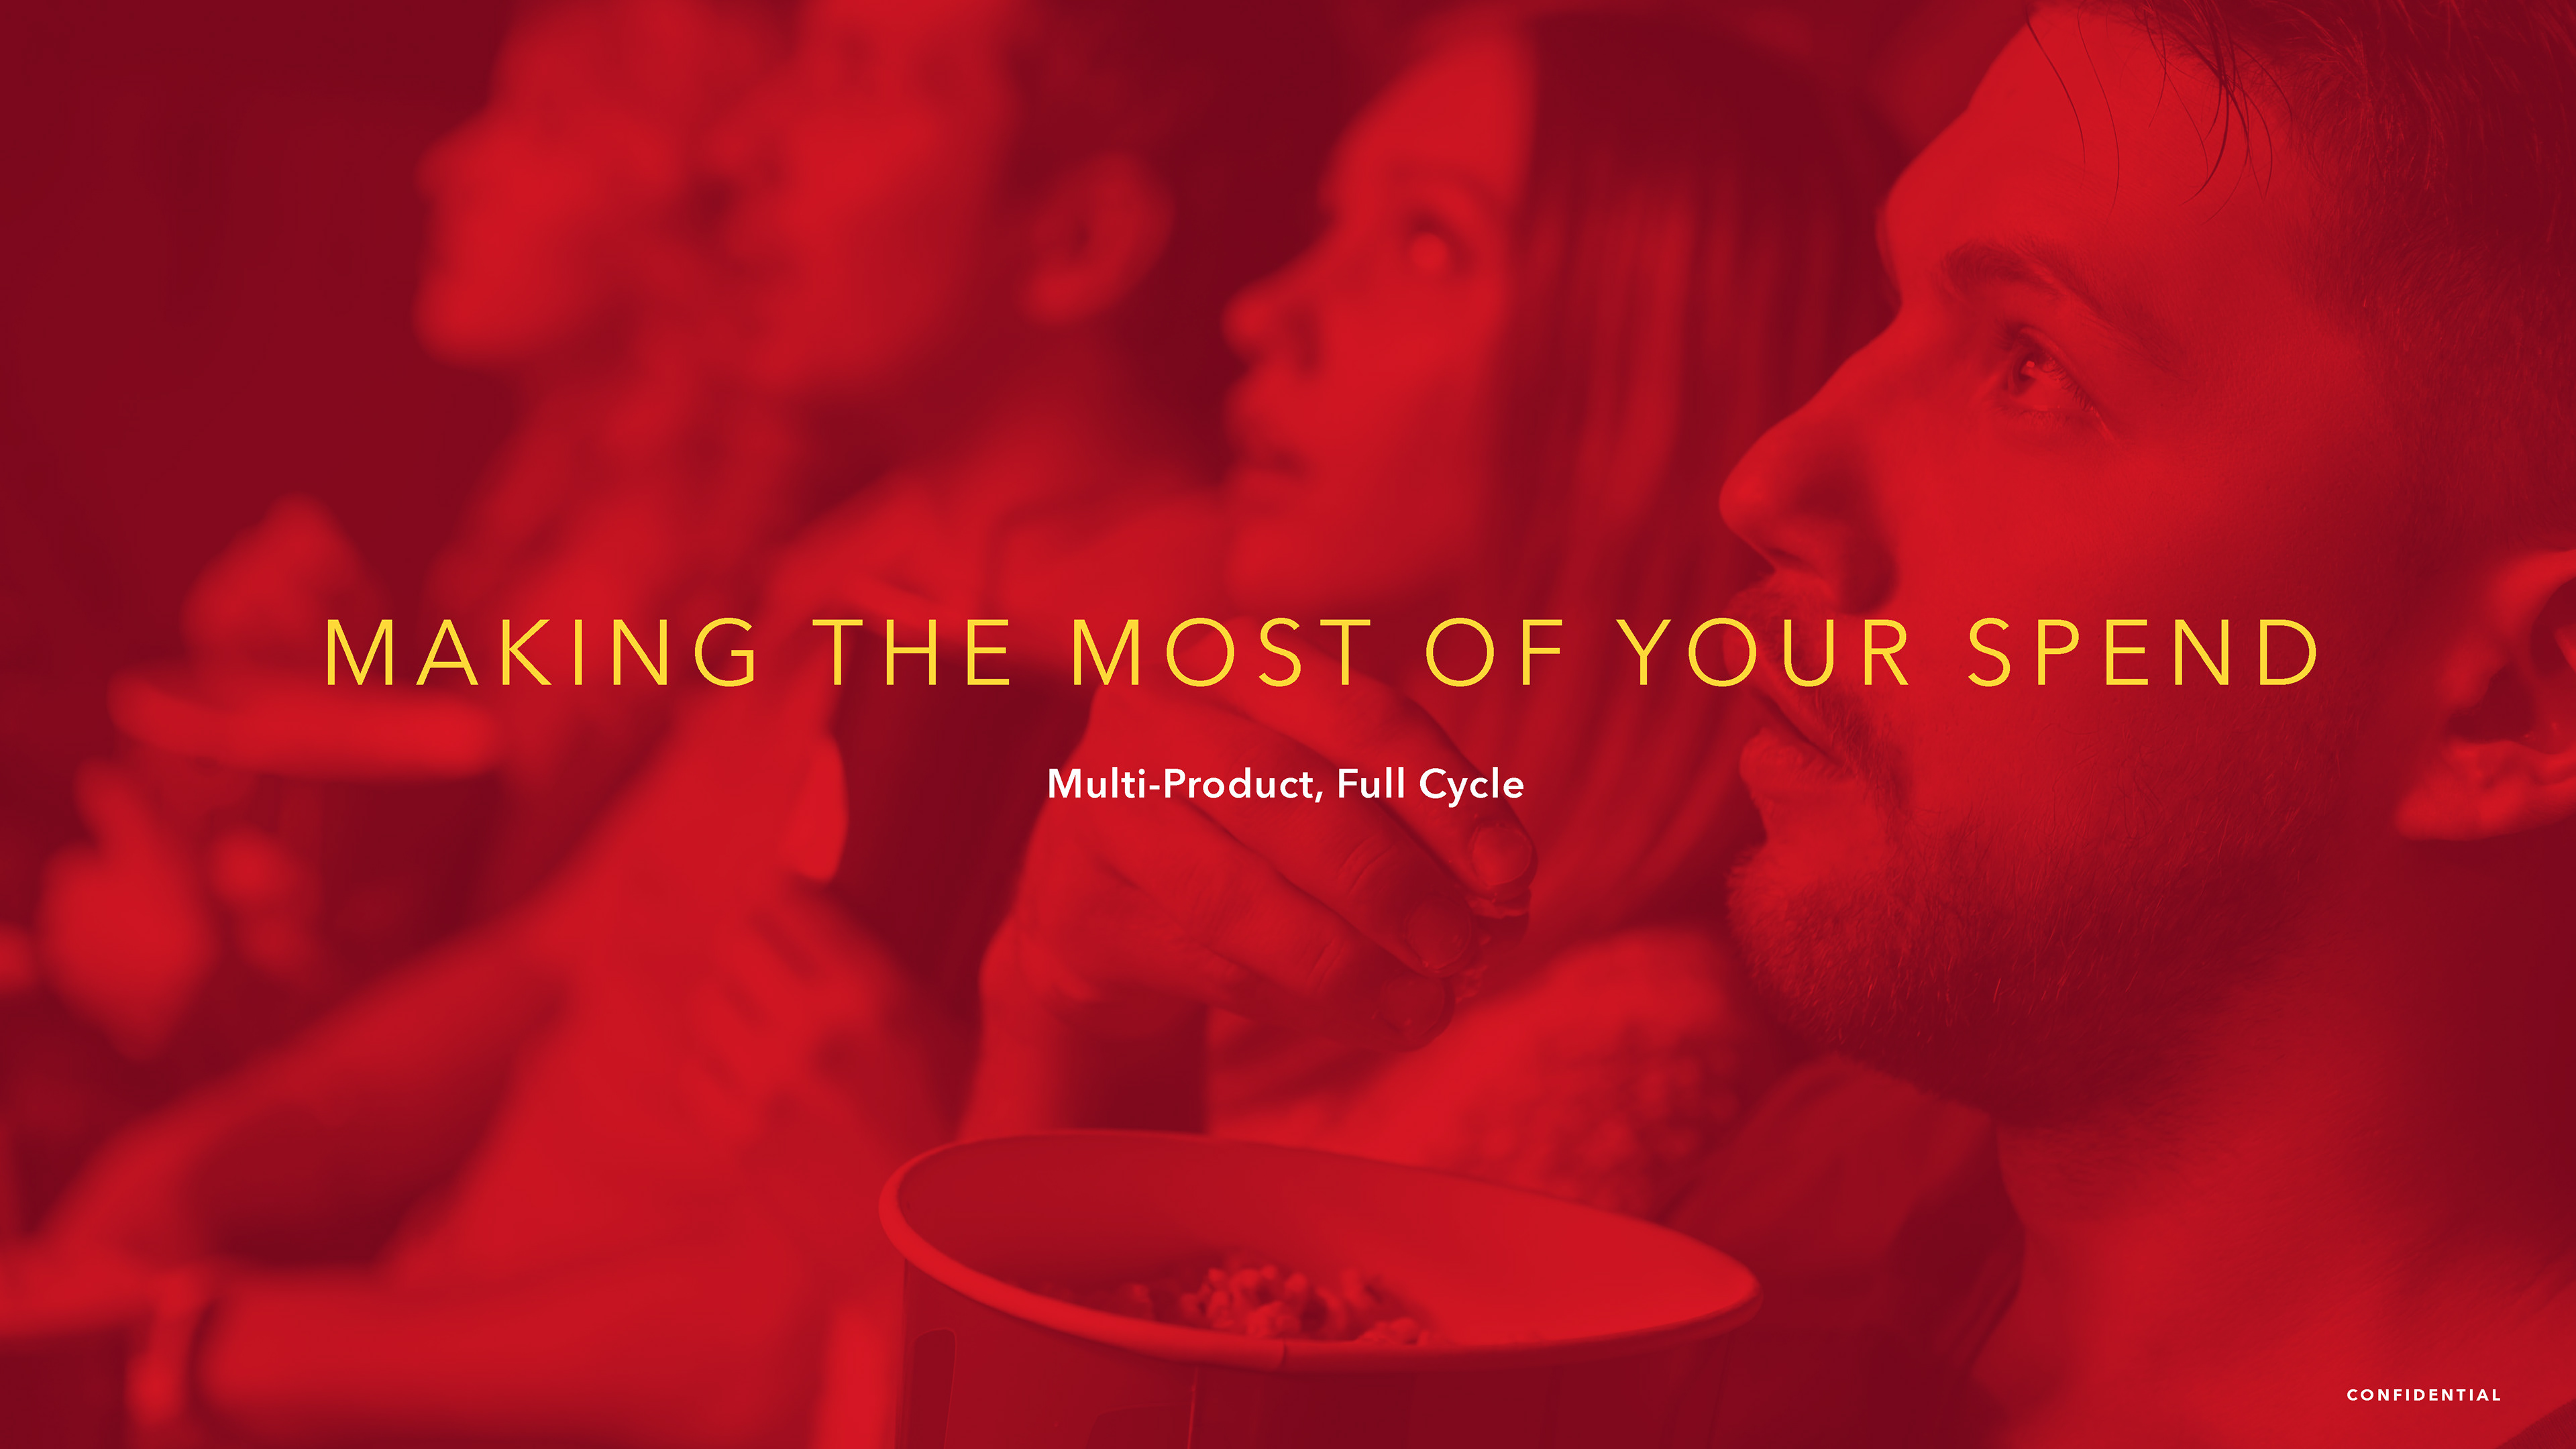
PRESENTATION DECK DESIGN
LAYOUT, TYPOGRAPHY, DATA VISUALIZATION,
IMAGE SELECTION, AND PHOTO MANIPULATION
IMAGE SELECTION, AND PHOTO MANIPULATION
Project DATE | 2019
CLIENT
www.thewrap.com

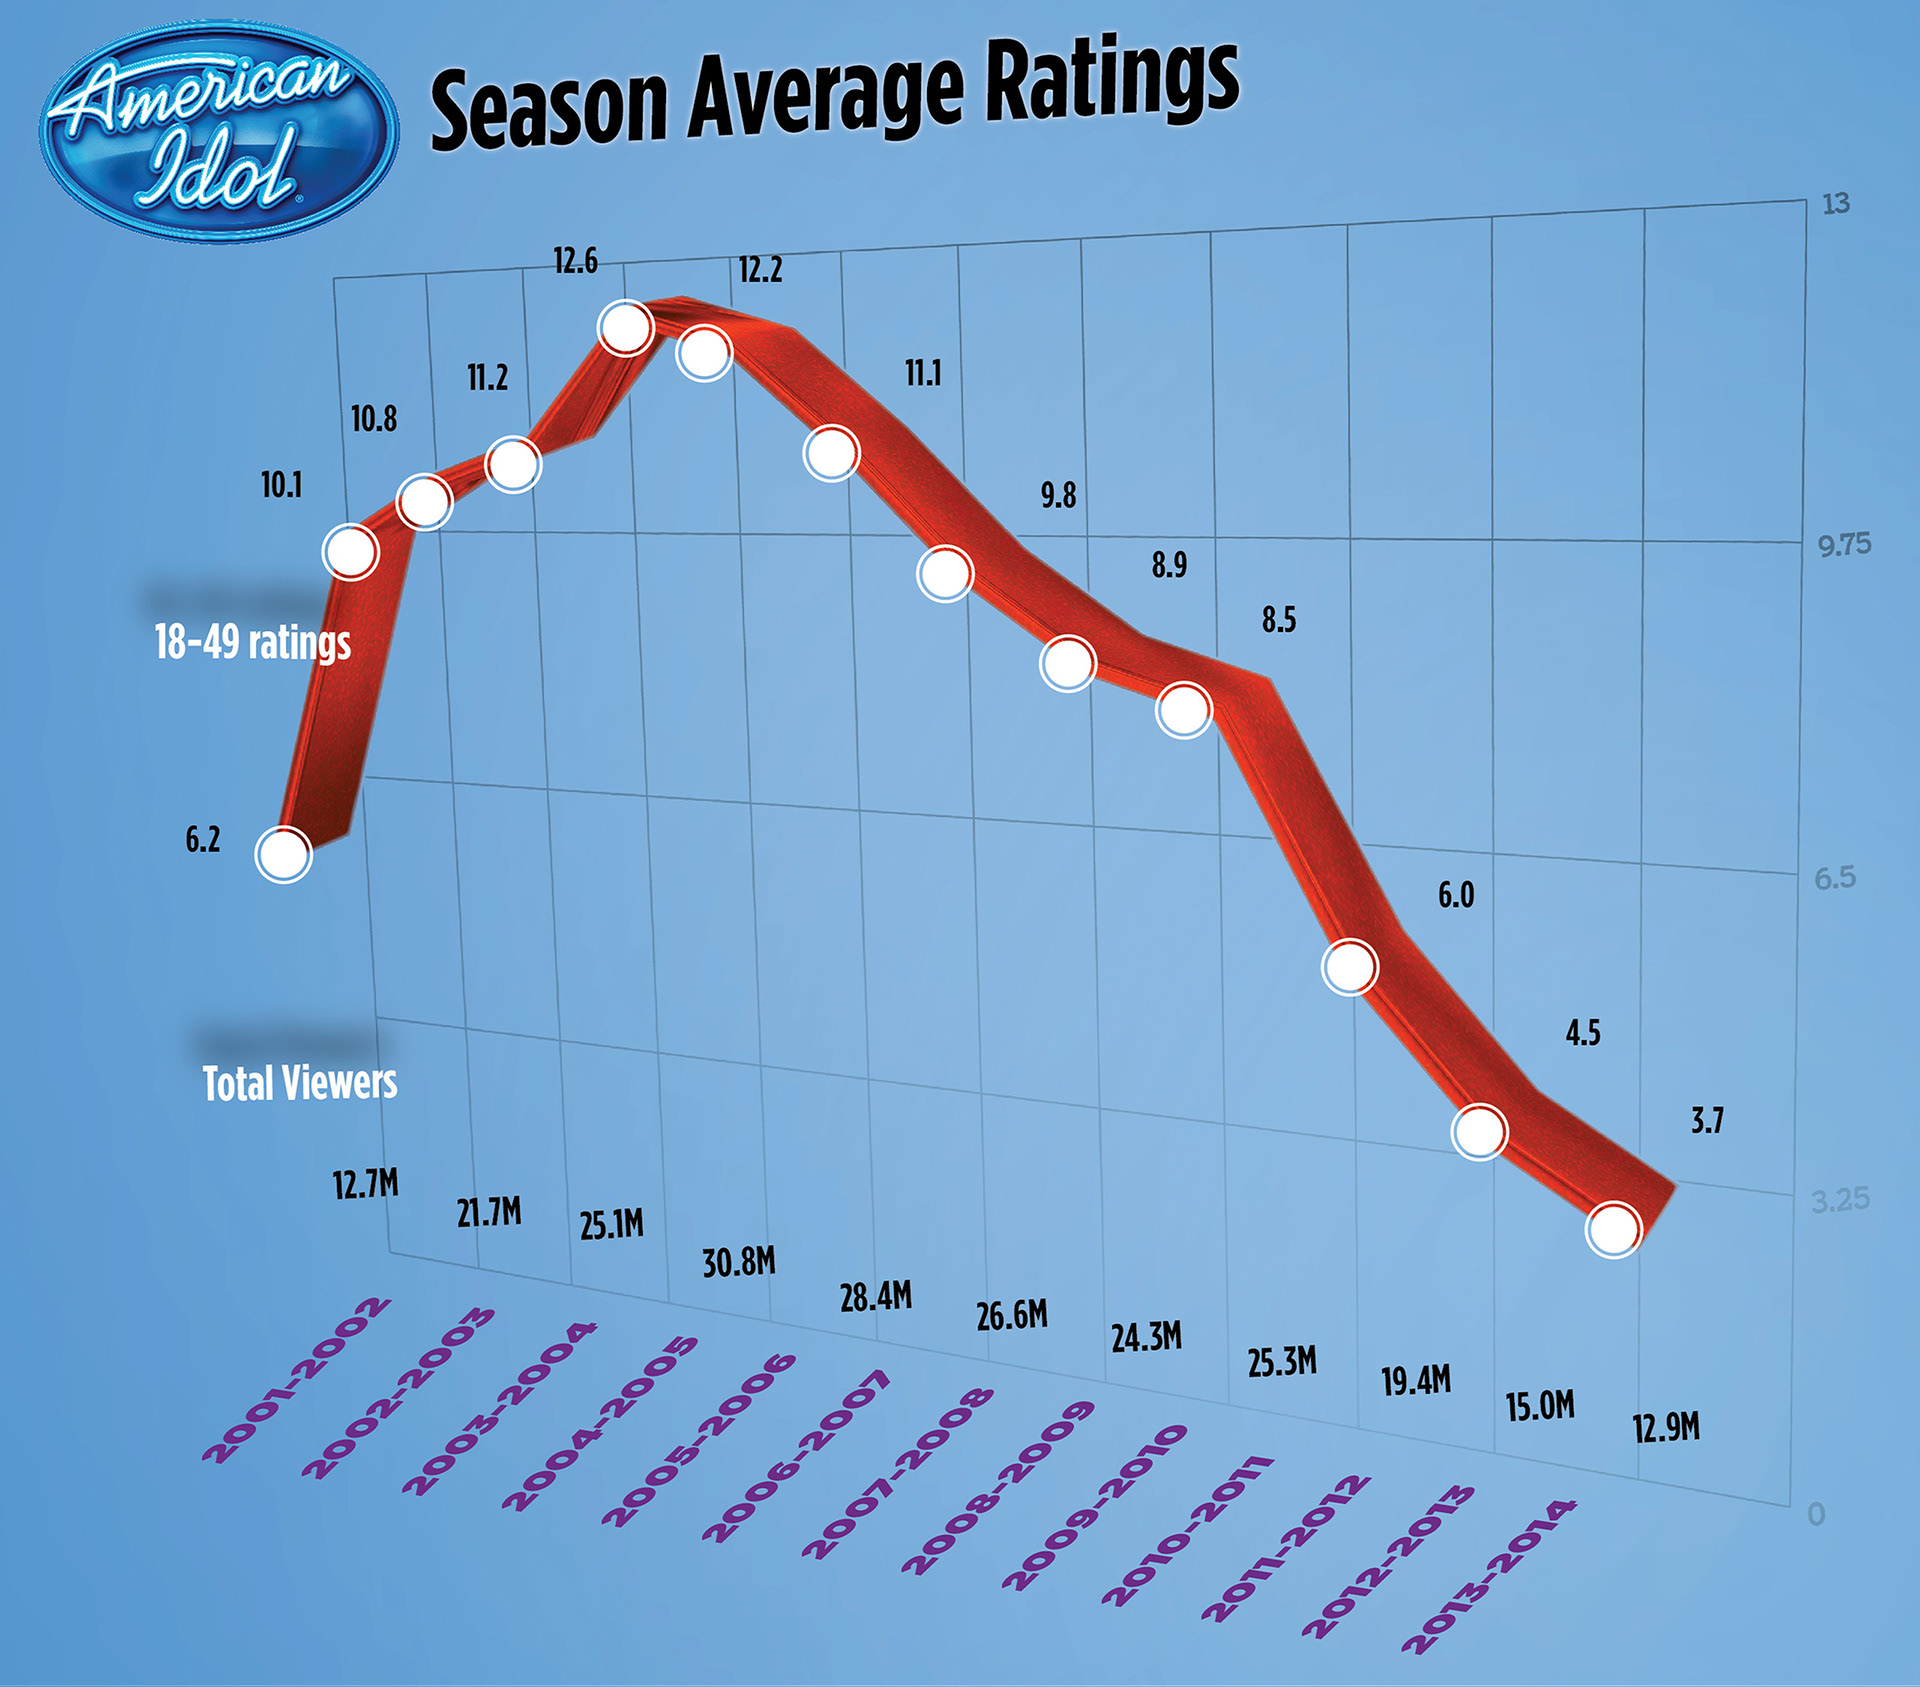
EDITORIAL STORY
DATA SUPPLEMENTALS
DATA SUPPLEMENTALS
CONCEPT, LAYOUT, AND TYPOGRAPHY
Project DATE | 2014
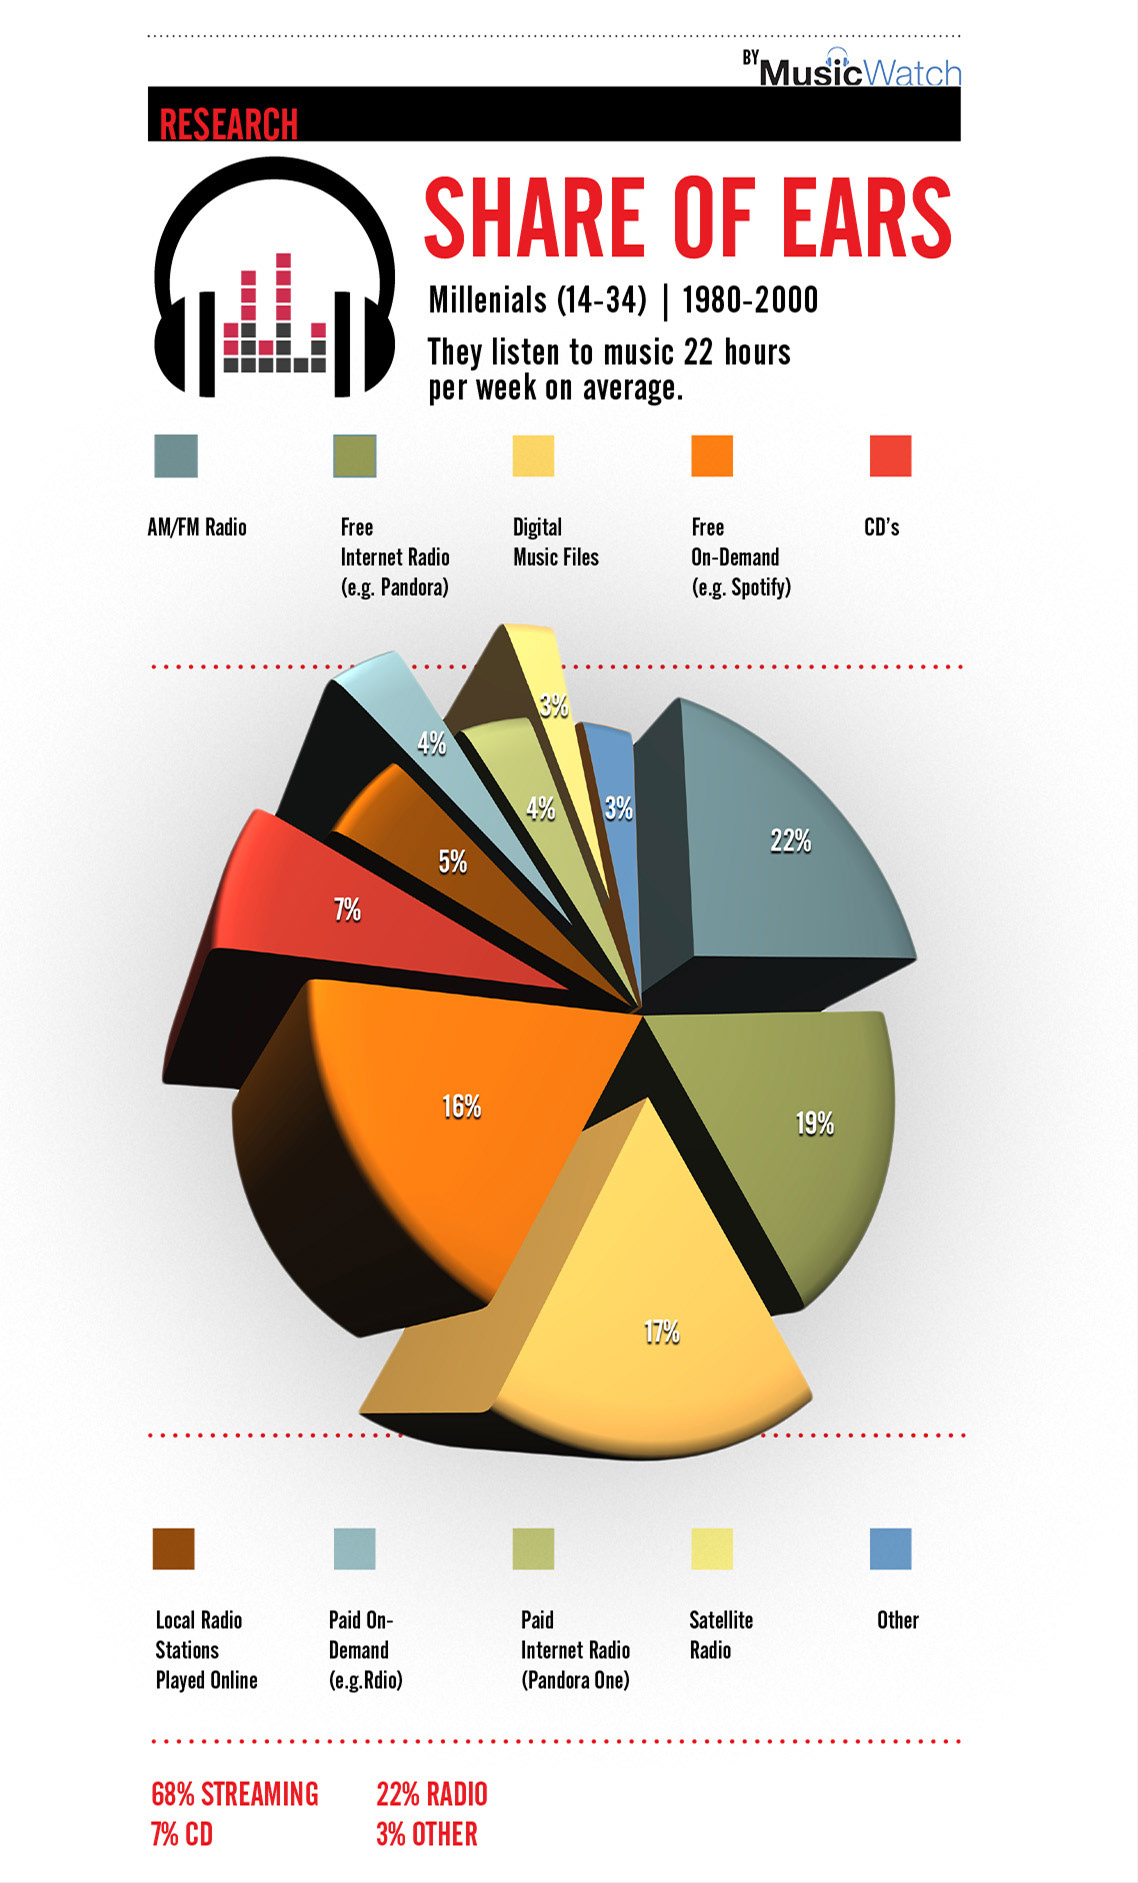
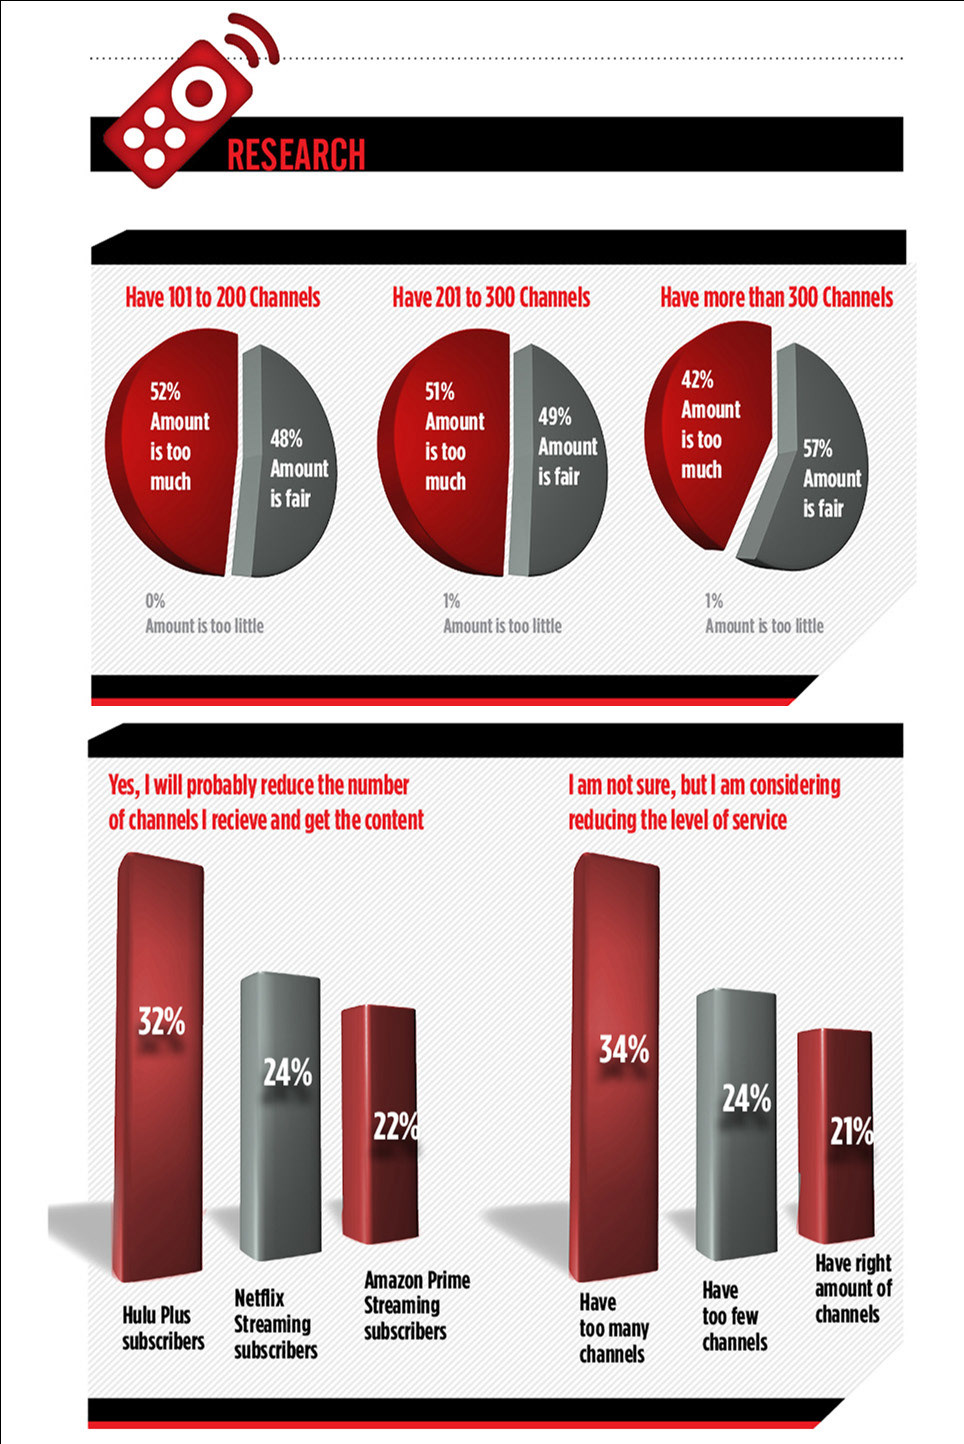
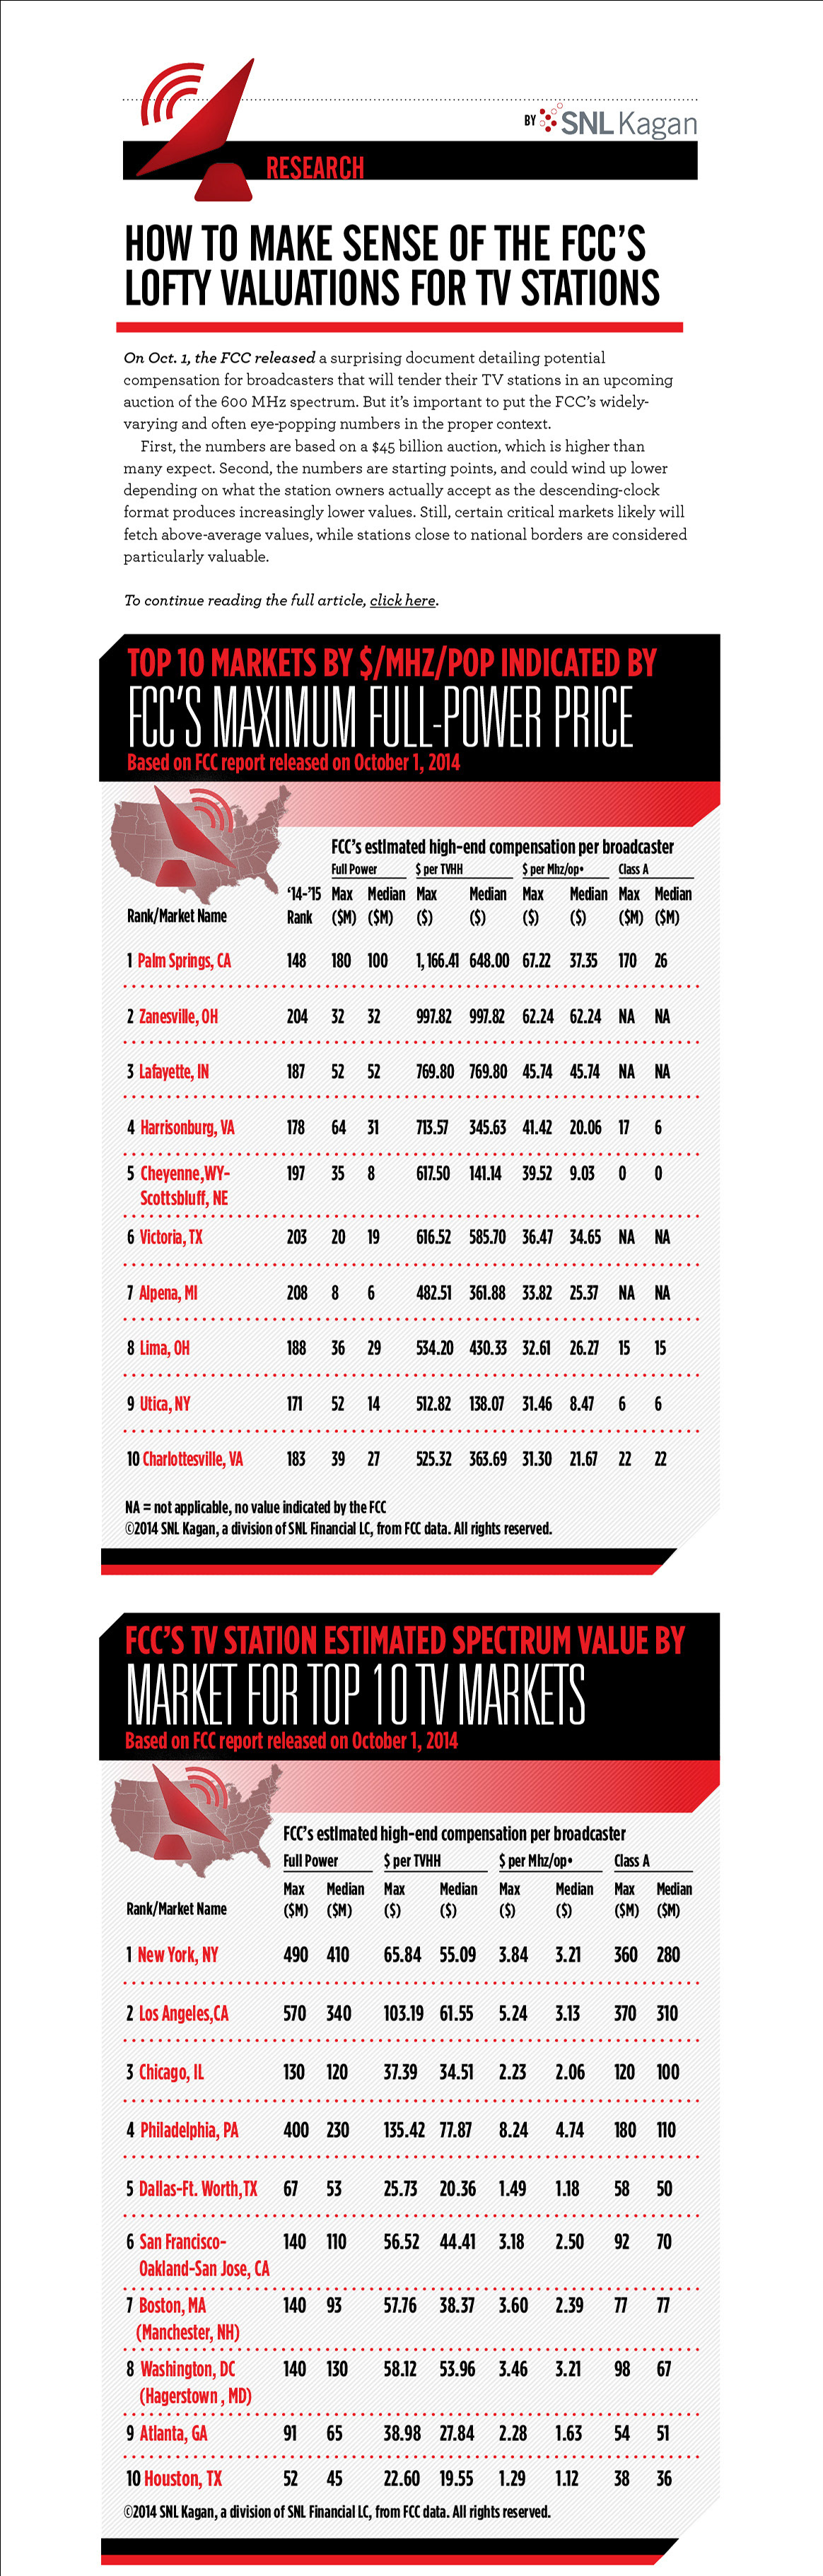


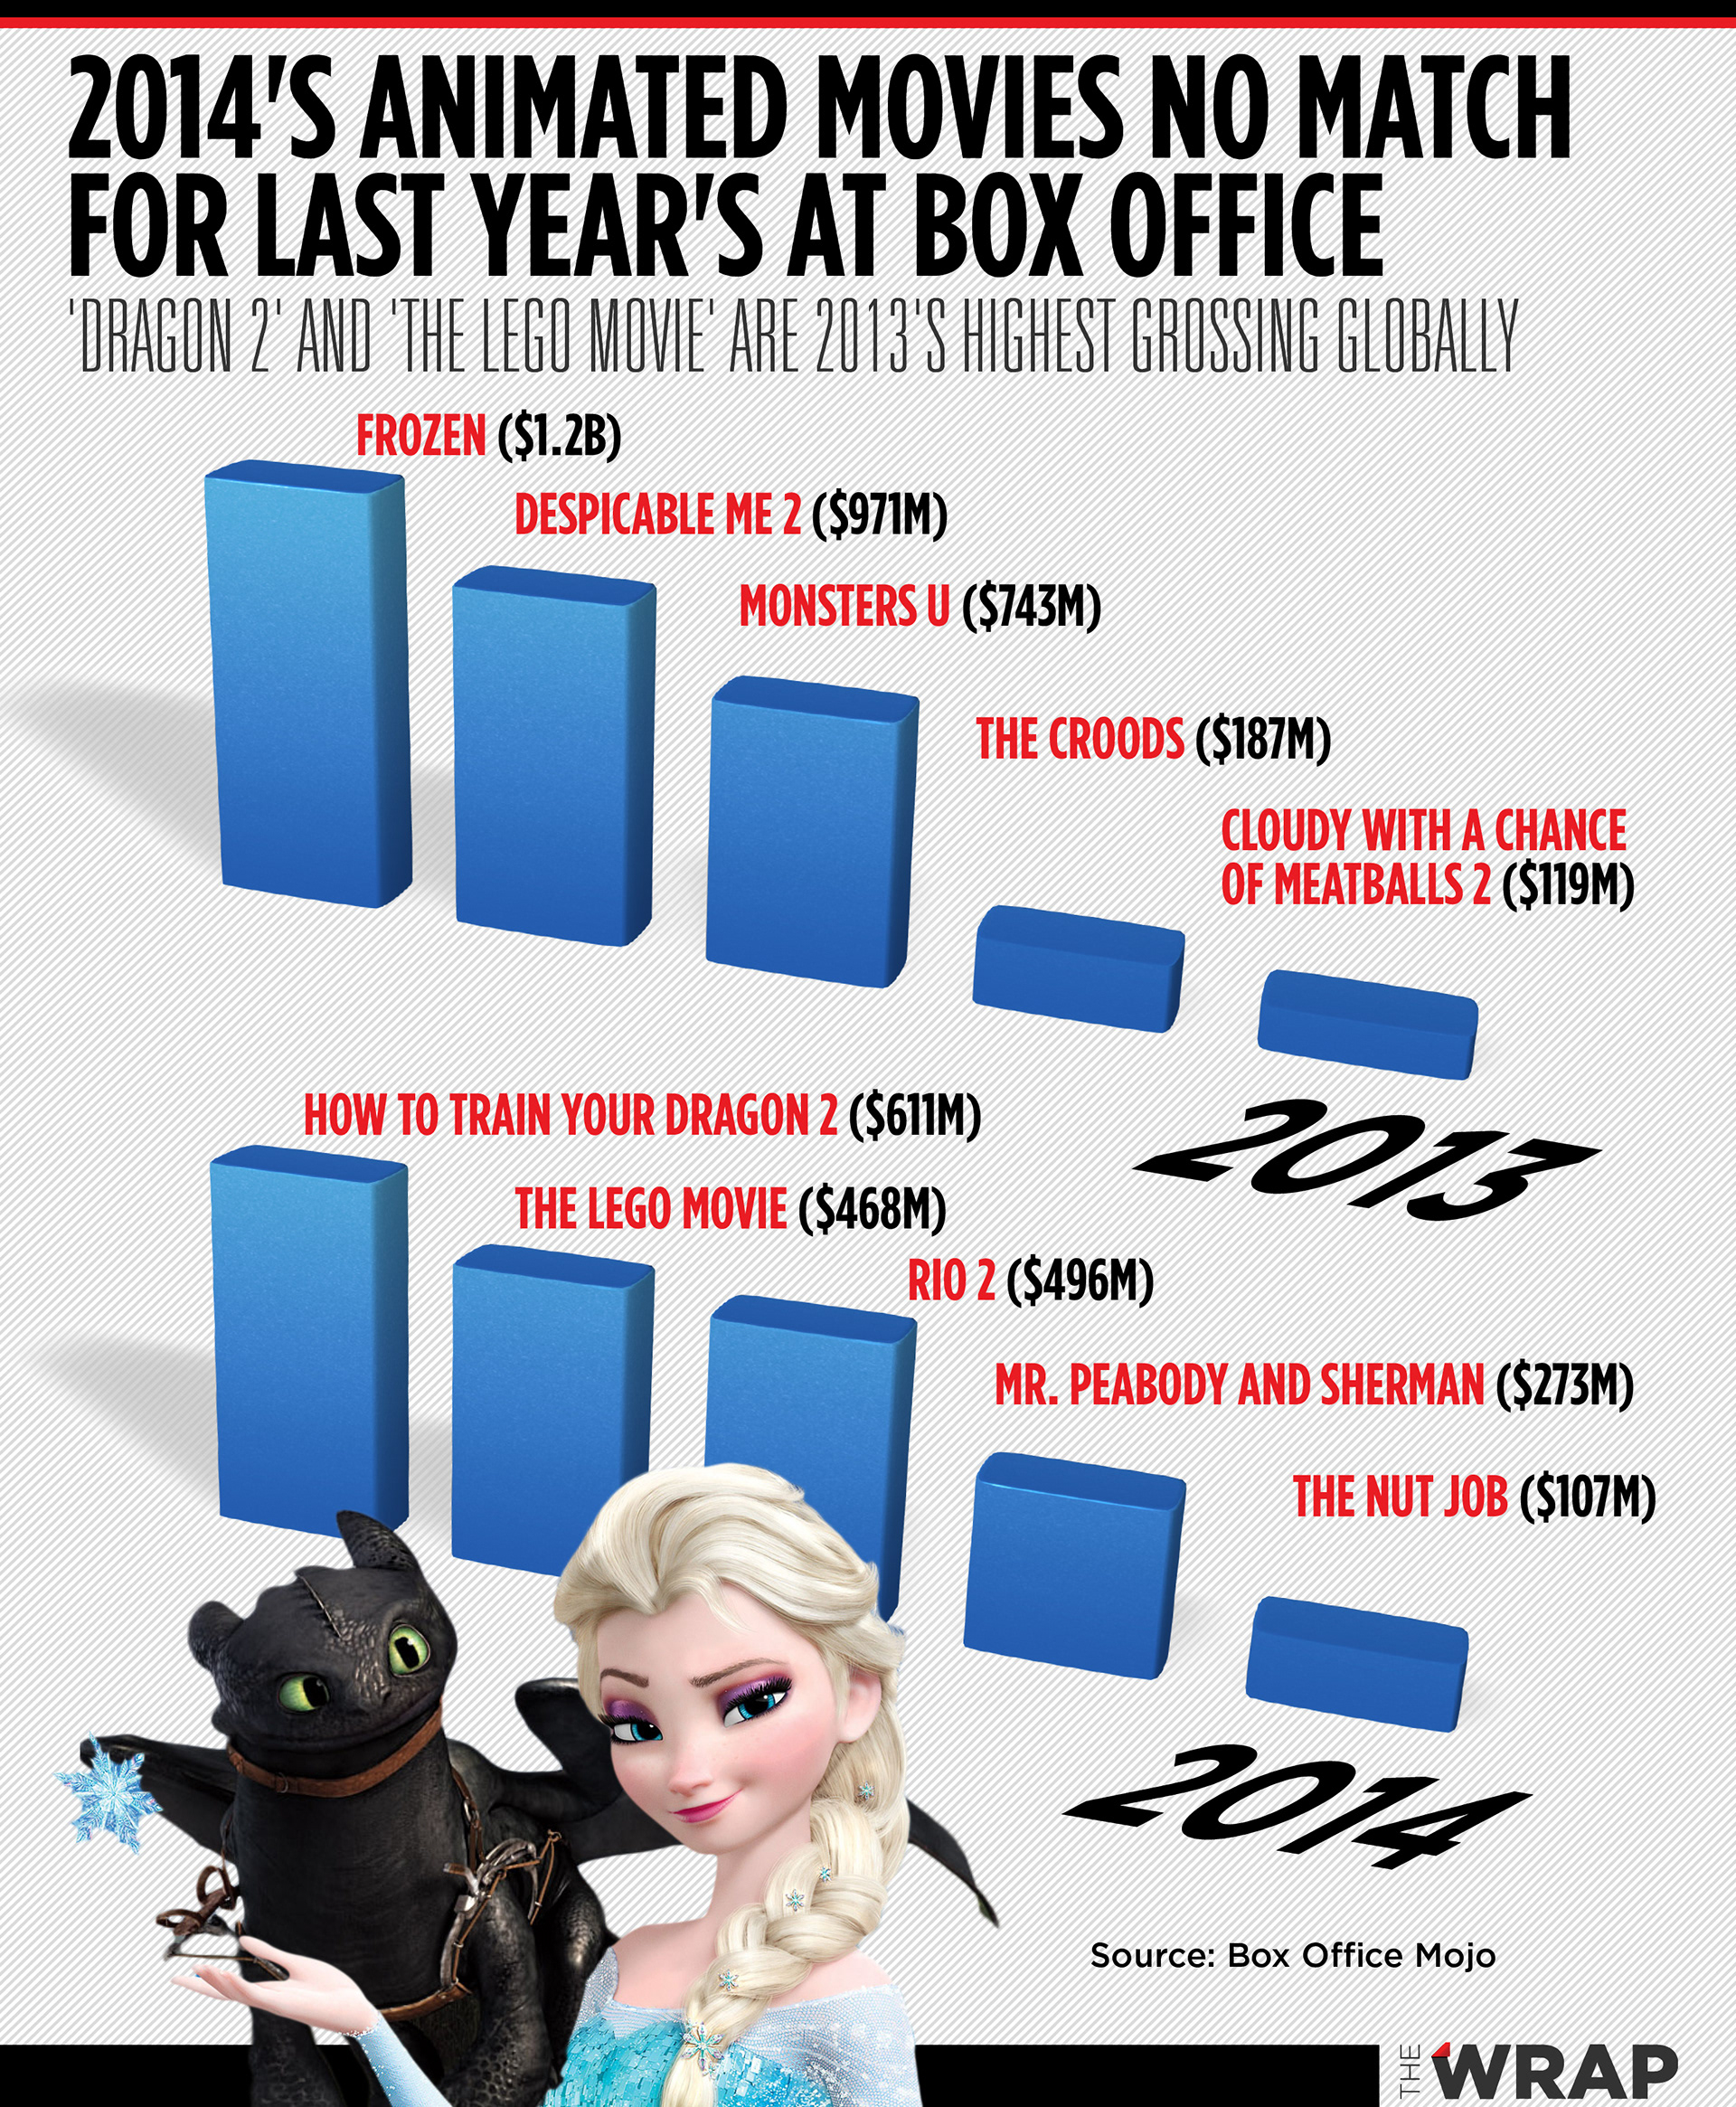
EDITORIAL STORY
DATA SUPPLEMENTAL
DATA SUPPLEMENTAL
CONCEPT, LAYOUT, AND TYPOGRAPHY
Project DATE | 2014